Arbitrum Price Prediction: Bears in Action as ARB/USD Breaks Below the Moving Averages
Estimated Reading Time: 3 minutes
Don’t invest unless you’re prepared to lose all the money you invest. This is a high-risk investment and you are unlikely to be protected if something goes wrong. Take 2 minutes to learn more
Arbitron (ARB) Price Prediction – August 17
Following the last price drop across the crypto space in recent days, the Arbitrum price prediction shows that ARB may gain more downtrends.
ARB/USD Market
Key Levels:
Resistance levels: $1.25, $1.30, $1.35
Support levels: $0.70, $0.65, $0.60
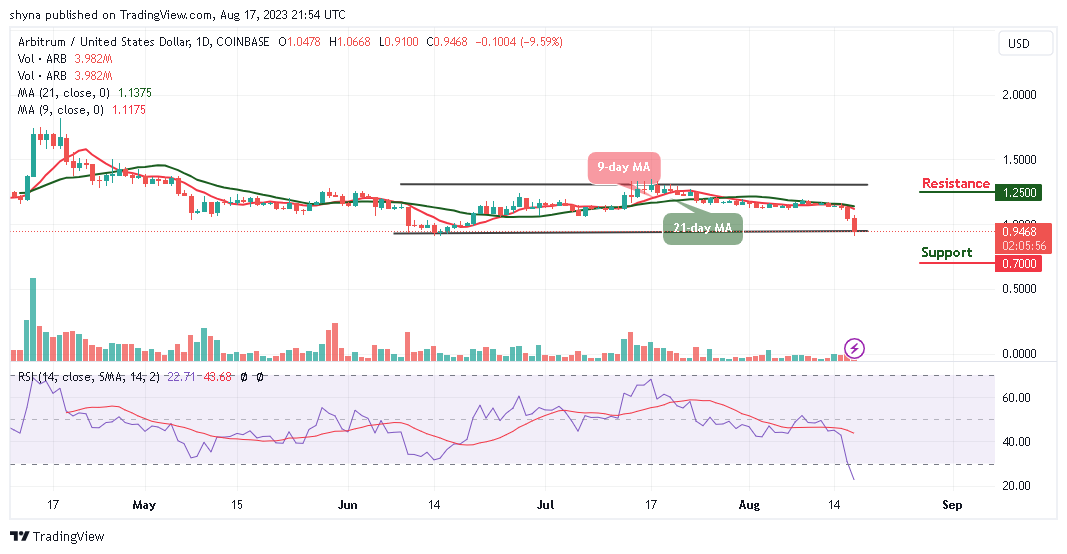
Since the past few days, ARB/USD trading has been following a bearish scenario as price action drops daily except for the past few days. Moving within the channel, Arbitrum is currently trading below the 9-day and 21-day moving averages following this week’s heavy selling pressure in the market over the past 2-days of trading.
Arbitrum Price Prediction: What to Expect from Arbitron (ARB)
At the time of writing, the Arbitrum price bearish scenario is even more dominant as sellers continue to post firm commitments. We could see a sharp drop in support of $0.90 and $0.85. Breaking the aforementioned support could further weaken the market to $0.70, $0.65, and $0.60. Meanwhile, a higher possible swing is likely to retest the previous resistance levels of $1.05 and $1.10. If the bulls manage to fuel the market with the mentioned resistance levels, traders can expect a further increase to $1.25, $1.30, and $1.35.
However, the technical indicator Relative Strength Index (14) is now showing a downward trend, indicating the latest selling pressure on the market and at the same time meeting reliable support at $0.94. Therefore, a low break for Arbitrum (ARB) could be imminent.
Looking at the 4-hour chart, ARB/USD is trading below the moving averages after hitting another solid support at $0.91. However, the Arbitrum price could see another sharp drop below the lower boundary of the channel. Breaking this barrier could further take the market to critical support levels at $0.82 and below.

Nevertheless, the Arbitrum price is trading at the $0.94 level, if the bulls can hold the price as it is and move the market to the next level, the next key targets for the bulls lie at $1.00 and $1.05 respectively. Reaching these levels might move it to $1.10 and above. Meanwhile, the Relative Strength Index (14) is now lying within the oversold region, indicating a bearish movement for the coin.
Place winning Arbitrum trades with us. Get ARB here