Polygon (POL) Price Prediction: POL/USDT Market Still Lacks Upside Drive
Estimated Reading Time: 3 minutes
Don’t invest unless you’re prepared to lose all the money you invest. This is a high-risk investment and you are unlikely to be protected if something goes wrong. Take 2 minutes to learn more

Polygon (POL) Price Prediction: June 23
The Polygon market has failed to maintain consolidation within the $0.7619 to $0.6425 price range. This indicates that the market has not attracted enough buyers to halt the freefall, as it has continued downward ever since.
POL/USDT Long-term Trend: Bearish (Daily Chart)
Key Price Levels:
Resistance Levels: $0.6000, $0.7000, and $0.8000
Support Levels: $0.5000, $0.4000, and $0.3000
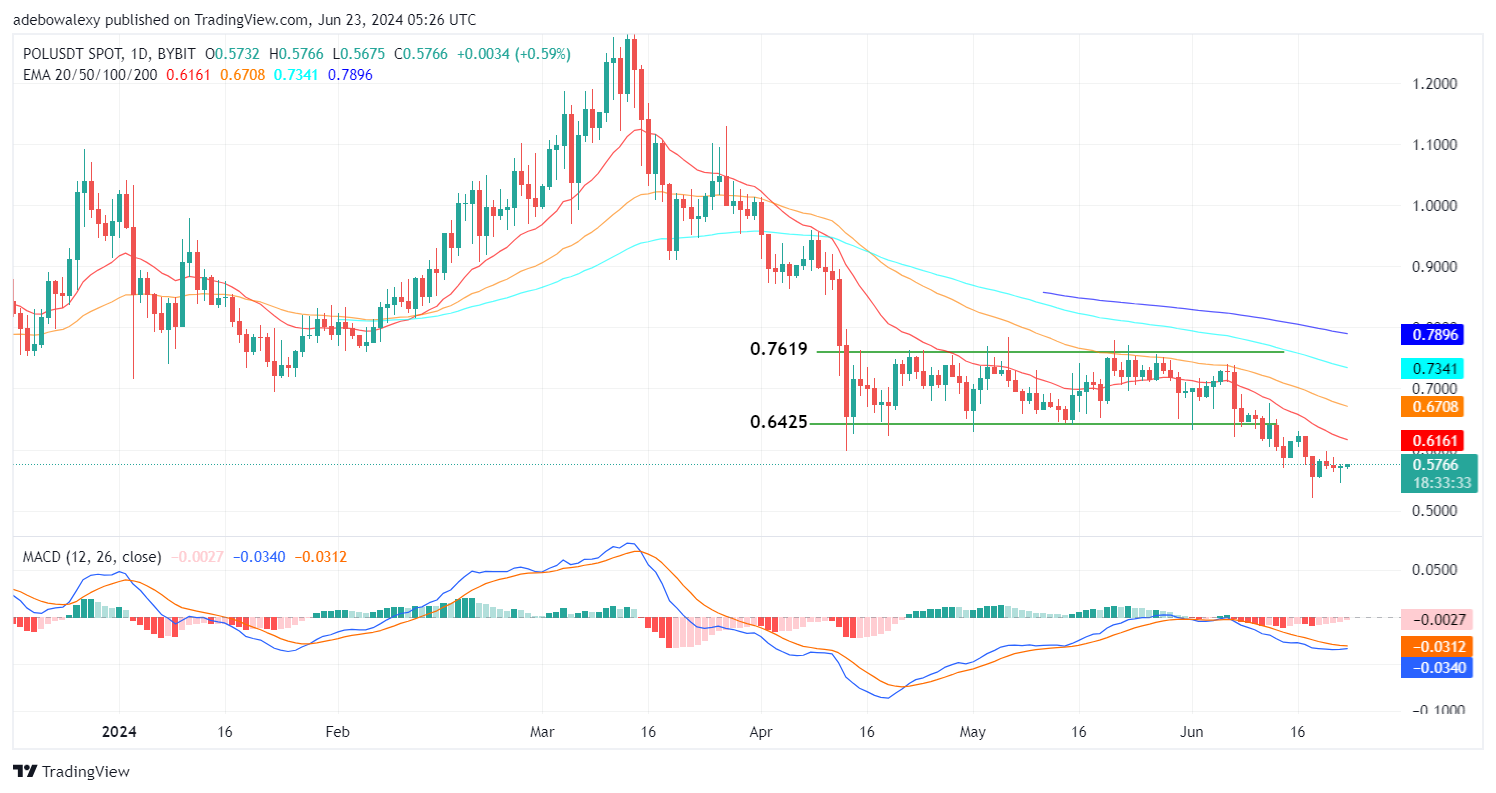
Following the break of support at $0.6425, the market also broke psychological support at $0.6000. Consequently, the token is trading below the Exponential Moving Average (EMA) lines. However, the market has taken a more sideways trajectory over the past four sessions. As a result, the Moving Average Convergence Divergence (MACD) indicator bars are now pale red, while the indicator lines are trending sideways.
Polygon Price Prediction: Will the POL/USDT Market End Downward Retracement Now?
Technically, price action in the Polygon daily market has continued to find lower support levels due to headwinds. In the past four sessions, the market saw a moderate upside correction, which has kept the market somewhat afloat. However, since then, price action still appears to lack a significant upside push, resulting in a somewhat sideways market.
The current session has appeared as a green price candle but has a tiny body that shows minimal gains. Furthermore, the MACD indicator has also indicated a slight change in direction, with the indicator lines now trending sideways. For the most part, it appears that the market has paused its downward retracement.
POL/USDT Medium-term Trend: The Polygon Market Tries to Secure More Upside Push (4H Chart)
The Polygon 4-hour market has revealed that upside forces are trying to propel the market upward. Here, it can be seen that for the past four sessions, price activity has been hugging the 20-day EMA line. The last price candle can be seen poking above the 20-day EMA line but retracting below it in the live market. Likewise, the MACD indicator lines are taking an upward trajectory, and the indicator bars are now appearing green above the equilibrium level.

From a technical point of view, upside forces are making some attempts. The fact that price action is still lurking around the 20-day EMA lines suggests that upside forces may gain momentum if they eventually find support above the 20-day EMA line. The MACD display shows that the momentum to do so may just be building up. Therefore, traders can hope to see the market break above the $0.6000 price level and possibly move upwards from there towards the $0.6500 mark.