Solana (SOL) Price Prediction: SOL/USDT Falls Below the $140 Threshold
Estimated Reading Time: 3 minutes
Don’t invest unless you’re prepared to lose all the money you invest. This is a high-risk investment and you are unlikely to be protected if something goes wrong. Take 2 minutes to learn more

Solana (SOL) Price Prediction: June 21
As anticipated, Solana’s price action has fallen below the $140 price level. Technical indicators had earlier spotted the trend, and the market proceeded in the revealed direction. Even now, the market seems to maintain the same prospect of forging lower as we continue.
SOL/USDT Long-term Trend: Bullish (Daily Chart)
Key Price Levels:
Resistance Levels: $140, $150, and $160
Support Levels: $130, $120, and $110
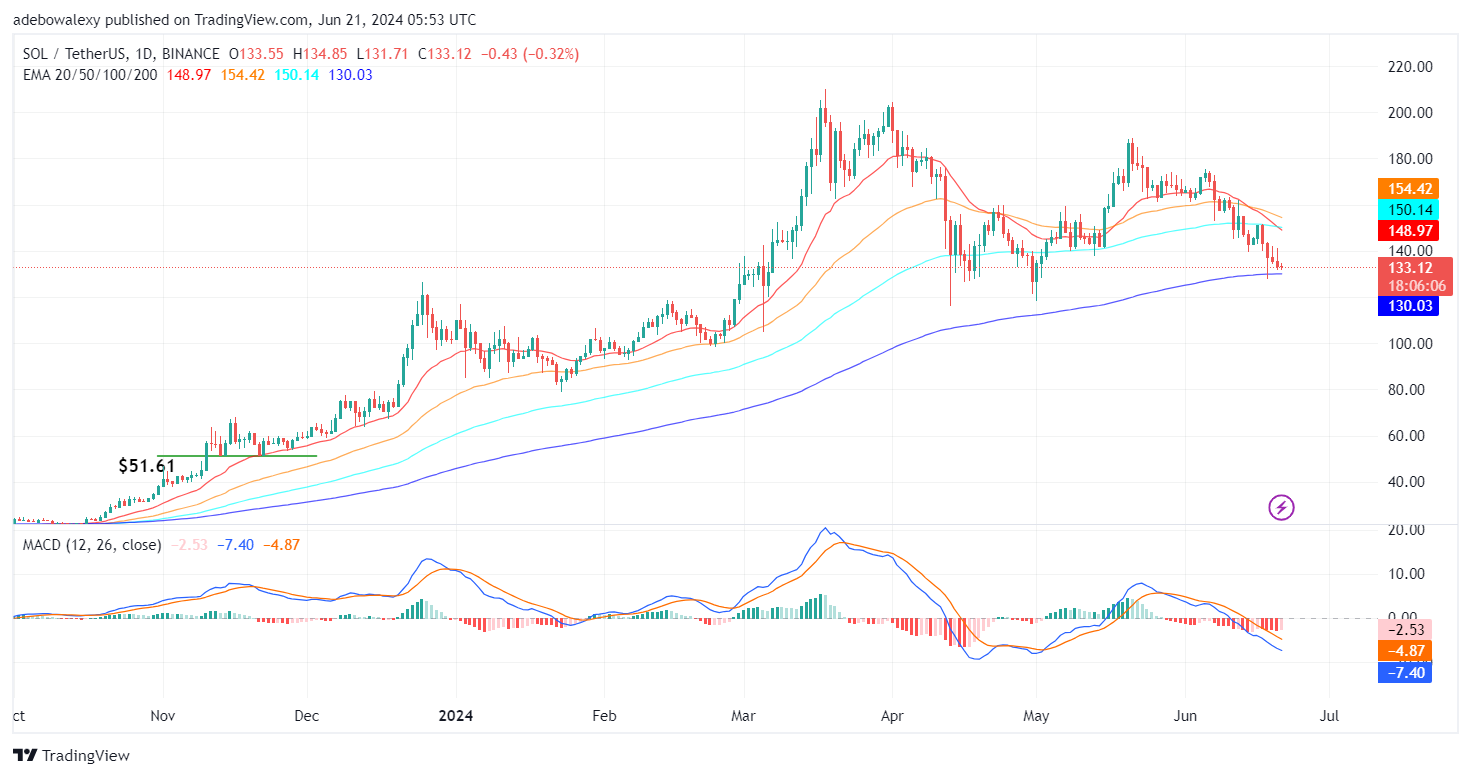
Price action in the Solana market had rebounded downward off the 100-day Exponential Moving Average (EMA) line. The market has proceeded downward since then, continuing over the past four trading sessions. The current session appears as a small doji price candle near the top of the 200-day EMA line. The Moving Average Convergence Divergence (MACD) lines can be seen falling downward after crossing below the equilibrium level. It should be noted that the last bar of this indicator below the equilibrium line is now pale red and appears shorter than the previous one.
Solana Price Prediction: SOL/USDT Price Action Seems to Present Weak Resistance
It can be perceived that downward momentum has reduced significantly since prices rebounded off the resistance formed by the 100-day EMA line. It seems that upside forces have been fighting back but lack the necessary support to prevail. However, the last price candle shows that upside forces are intensifying efforts.
This is further revealed by the pale appearance of the last bar of the MACD indicator below the equilibrium level. Be that as it may, price action is still up against significant opposition and may still be overwhelming.
SOL/USDT Medium-term Trend: Bullish Resistance Intensifies Near the $130 Mark (4H Chart)
Solana’s price action has remained below the EMA lines even on the 4-hour price chart. However, unlike what was seen on the daily price chart, the last price candle here is solid green, although small. Meanwhile, the MACD lines seem a bit conflicted, considering their sideways movement following a crossover below the equilibrium level.
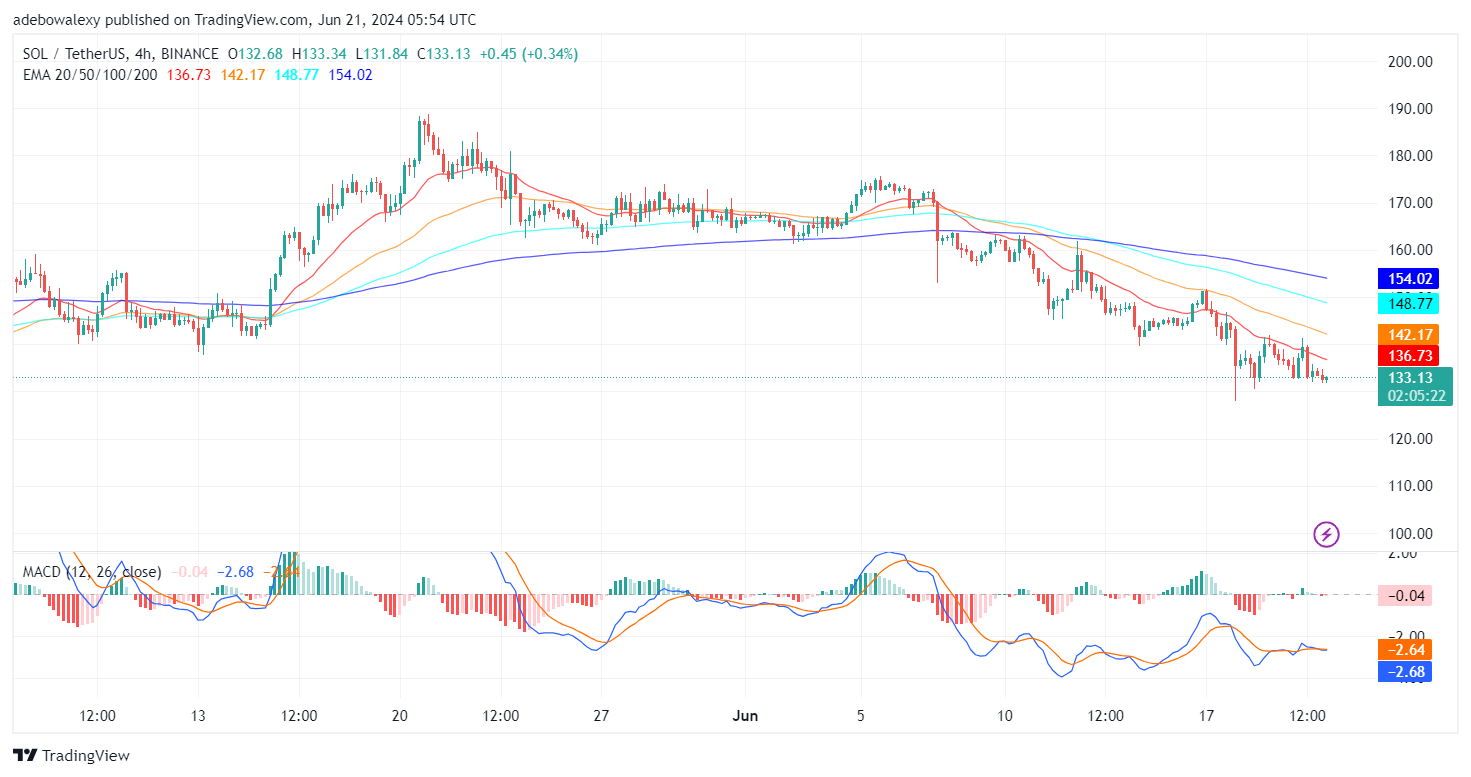
Based on the activities seen on the price chart, we can see that upside forces are staging some opposition against headwinds. Although this seems helpful for bullish anticipations, these signs are still too weak to base bullish decisions on. The current session continues to trade below the EMA lines. Likewise, the MACD indicator lines stay mostly sideways below the equilibrium level. Therefore, it is safe to anticipate a continued downward correction toward technical support at the $130 price level.