Uniswap (UNI) Price Prediction: UNI/USDT Break Fails
Estimated Reading Time: 3 minutes
Don’t invest unless you’re prepared to lose all the money you invest. This is a high-risk investment and you are unlikely to be protected if something goes wrong. Take 2 minutes to learn more

Uniswap (UNI) Price Prediction: June 20
After price action broke through the $11.40 price level, the following session behaved as if price action had found support above that level. However, price action dipped steeply through the $11.40 level, and today’s session shows that the market may proceed downward.
UNI/USDT Long-term Trend: Bullish (Daily Chart)
Key Price Levels:
Resistance Levels: $10.00, $12.00, and $14.00
Support Levels: $8.00, $6.00, and $4.00
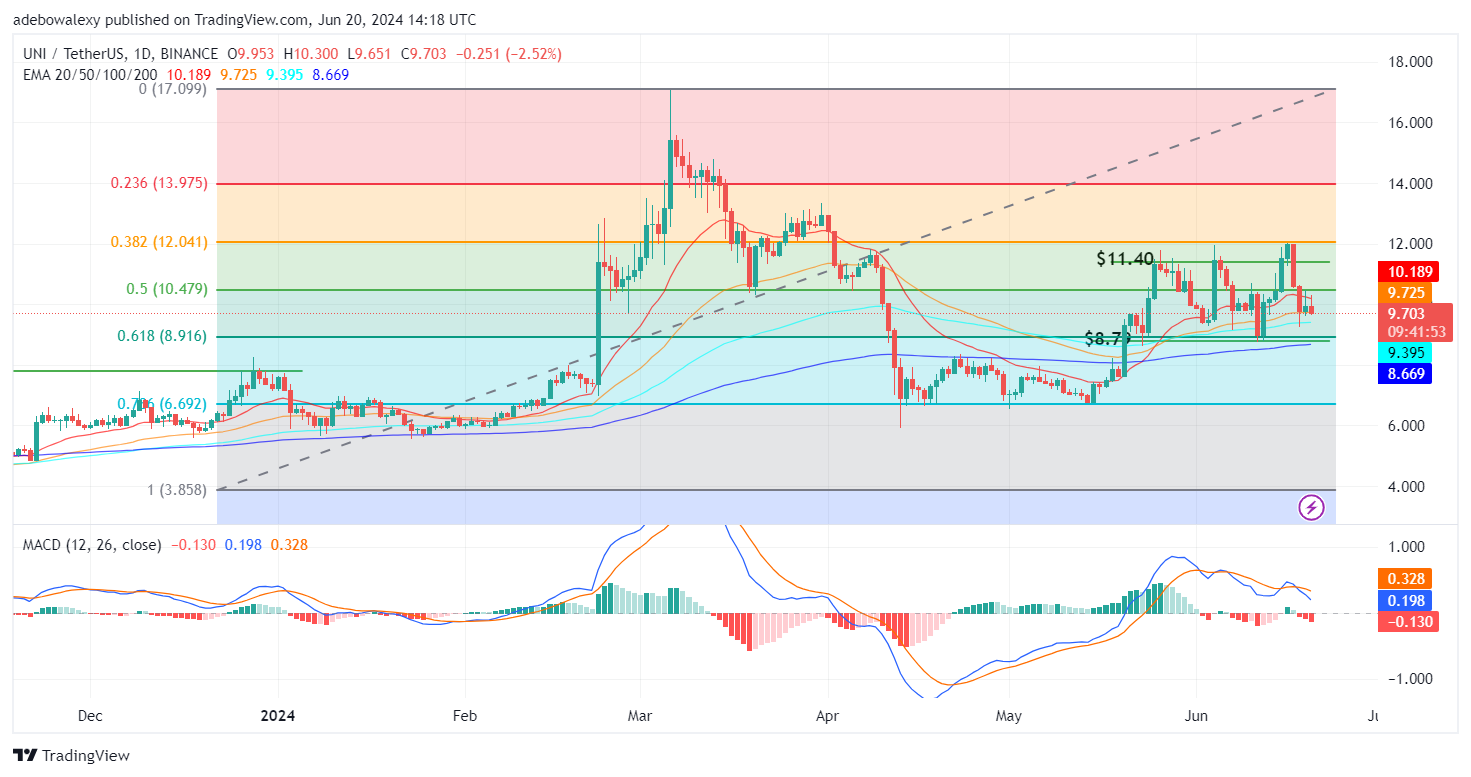
Price action in Uniswap can be seen landing above the 50-day Exponential Moving Average (EMA) lines. The last two sessions on this daily price chart appear as a tweezer pattern, which indicates a potential bearish continuation. The latest price candle suggests that the downward correction may resume. Similarly, the Moving Average Convergence Divergence (MACD) indicator lines have delivered a bullish crossover but are now proceeding downward toward the equilibrium level. Meanwhile, the MACD bars show that bearish momentum still looks potent enough to continue the downward correction.
Uniswap Price Prediction: UNI/USDT Stays Under Bearish Influences
The downward correction has proceeded very steeply in the past two sessions. The previous session had paused at the 50-day EMA line. The ongoing session appears bearish and seems to indicate that the downward correction may have resumed. Additionally, the latest price candle can be seen crossing below the 50-day EMA line.
Consequently, the price of the coin is now between the 20, 50, 100, and 200-day EMA lines. The signs on the MACD indicator suggest that downward forces have resumed. This can be seen as the bars of the indicator appear solid red and progressively get taller on the negative axis. Therefore, it can be inferred that prices may proceed toward lower price levels.
UNI/USDT Medium-term Trend: Downward Forces in the Uniswap Market Strengthen (4H Chart)
UNI/USDT price activity on a 4-hour market time frame can be seen trapped between the 100, 50, and 200-day EMA lines. However, the latest price candle can be seen breaking below the 200-day EMA line. This effectively places the market under more bearish pressure as the token now trades below all the EMA lines.
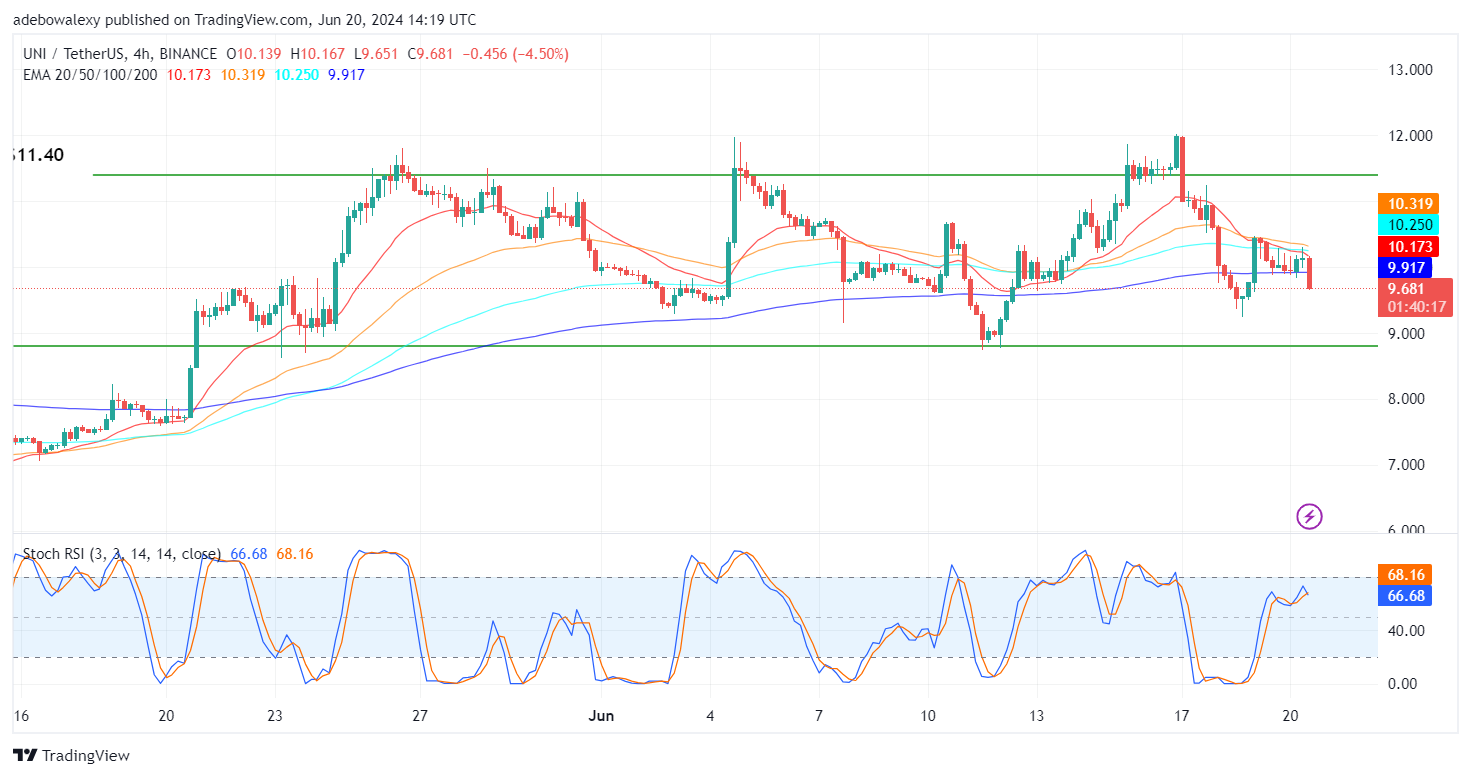
Additionally, the Stochastic Relative Strength Index (RSI) can be seen converging for a downward crossover below the 80 level of the SRSI indicator lines. This effectively hints that bears are of significant strength and may force the market toward technical support at the $9.00 price line.
