Bitcoin (BTC/USD) Price Experiences Significant Declines
Estimated Reading Time: 4 minutes
Don’t invest unless you’re prepared to lose all the money you invest. This is a high-risk investment and you are unlikely to be protected if something goes wrong. Take 2 minutes to learn more
Bitcoin Price Prediction – January 9
In what looks like a gradual market correction trend in the BTC/USD operations, the crypto-economic experiences significant declines in its valuation to now approach last September’s previous critical support trading line at $40,000. As of writing, the crypto’s price trades between a high of $41,789 and a low of $41,217, keeping a minute positive percentage rate of about 0.17.
BTC/USD Market
Key Levels:
Resistance levels: $45,000, $47,500, $50,000
Support levels: $40,000, $37,500, $35,000
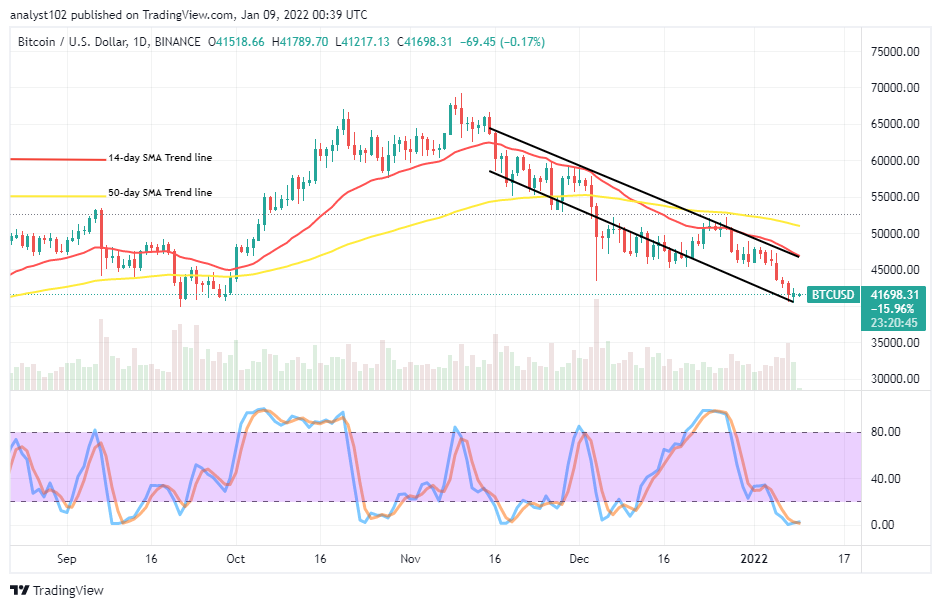
BTC/USD – Daily Chart
The BTC/USD market price experiences significant declines in its worth, as showcased by the daily trading chart. On January 5th, a bearish candlestick emerged, breaching a critical support baseline at $45,000 to affirm a return of bearish trend somewhat in full-fledged outlook. The 50-day SMA indicator is above the 14-day SMA indicator. The lower bearish channel has drawn closer to the support of $40,000. The Stochastic Oscillators are into the oversold region with their lines clogged tightly near the range of zero. That indicates that the price may have to swing around the current trading spot for some time before taking to a particular direction.
Has it been that the BTC/USD market operations have returned fully into a bearish trading cycle as the crypto-economic price experiences significant declines?
Relatively, it appears that the BTC/USD market operations have returned fully for a bearish trend trading cycle as the crypto-economic price experiences significant declines, having breached a critical baseline of around $45,000. The market levels between $45,000 and $47,500 will serve as the main resistance zones against any fearful bullish trading attempt in this crypto-economic activity. Price is likely to witness a line of rallying trading conditions around the $40,000 support level for some time if that value-line doesn’t surrender quickly to let in more depressions at this current capacity.|
On the downside of the technical analysis, the BTC/USD market short-position takers needed to exercise patience until active reverses of an upward price movement before considering launching more sell orders under the sell signal side of the 14-day SMA indicator. It may be too early now to exert a sell order position as it has indicated that the market is presently trading within an oversold region condition. Therefore, that is why to exercise some degree of patience for a while.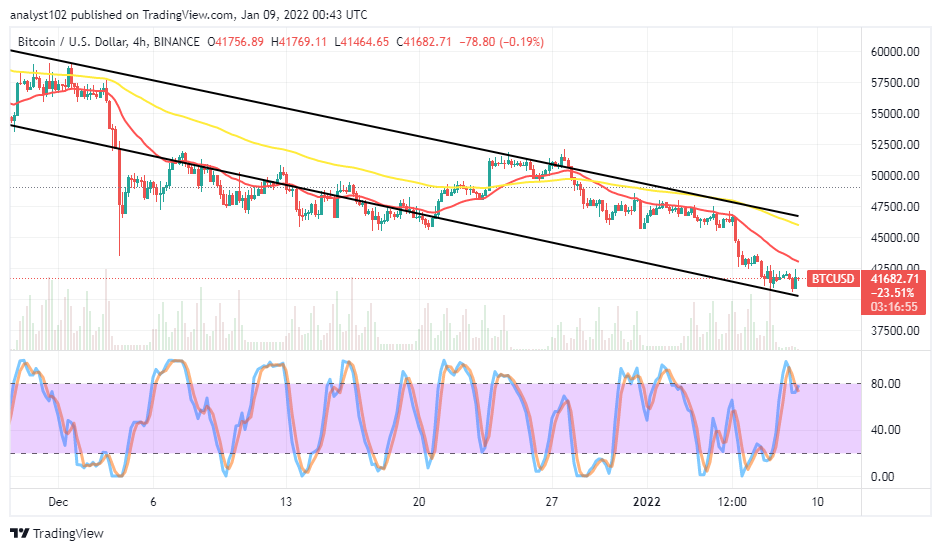
BTC/USD 4-hour Chart
The BTC/USD 4-hour chart reveals that the crypto-economic price experiences significant declines. It shows that a bearish trading cycle is returning on a gradual process as the 14-day SMA trend line is underneath the 50-day SMA trend line. And they both point toward the south direction. The Stochastic Oscillators have briefly crossed southbound against the range of 80. And, they attempt opening the lines slightly northbound tightly beneath the range of 80. That indicates that price may need to push up to test resistance around $42,500 before resuming a downward motion if that line isn’t sustainably breakout in the long-term run.
Note: Cryptosignals.org is not a financial advisor. Do your research before investing your funds in any financial asset or presented product or event. We are not responsible for your investing results.
You can purchase crypto coins here. Buy Tokens