Bitcoin (BTC) Price Prediction: BTC/USDT Recovers Above the $65,000 Mark
Estimated Reading Time: 3 minutes
Don’t invest unless you’re prepared to lose all the money you invest. This is a high-risk investment and you are unlikely to be protected if something goes wrong. Take 2 minutes to learn more

Bitcoin (BTC) Price Prediction: June 19
The Bitcoin market had earlier dipped below the medium-term support level of $65,000 in previous sessions. However, as of today, the market has recovered above the mentioned $65,000 support level. Although technical indicators haven’t given a clear indication that a significant upside correction may result from here, let’s take a more thoughtful look at the market.
BTC/USDT Long-term Trend: Bullish (Daily Chart)
Key Price Levels:
Resistance Levels: $67,000, $70,000, and $73,000
Support Levels: $62,000, $59,000, and $56,000
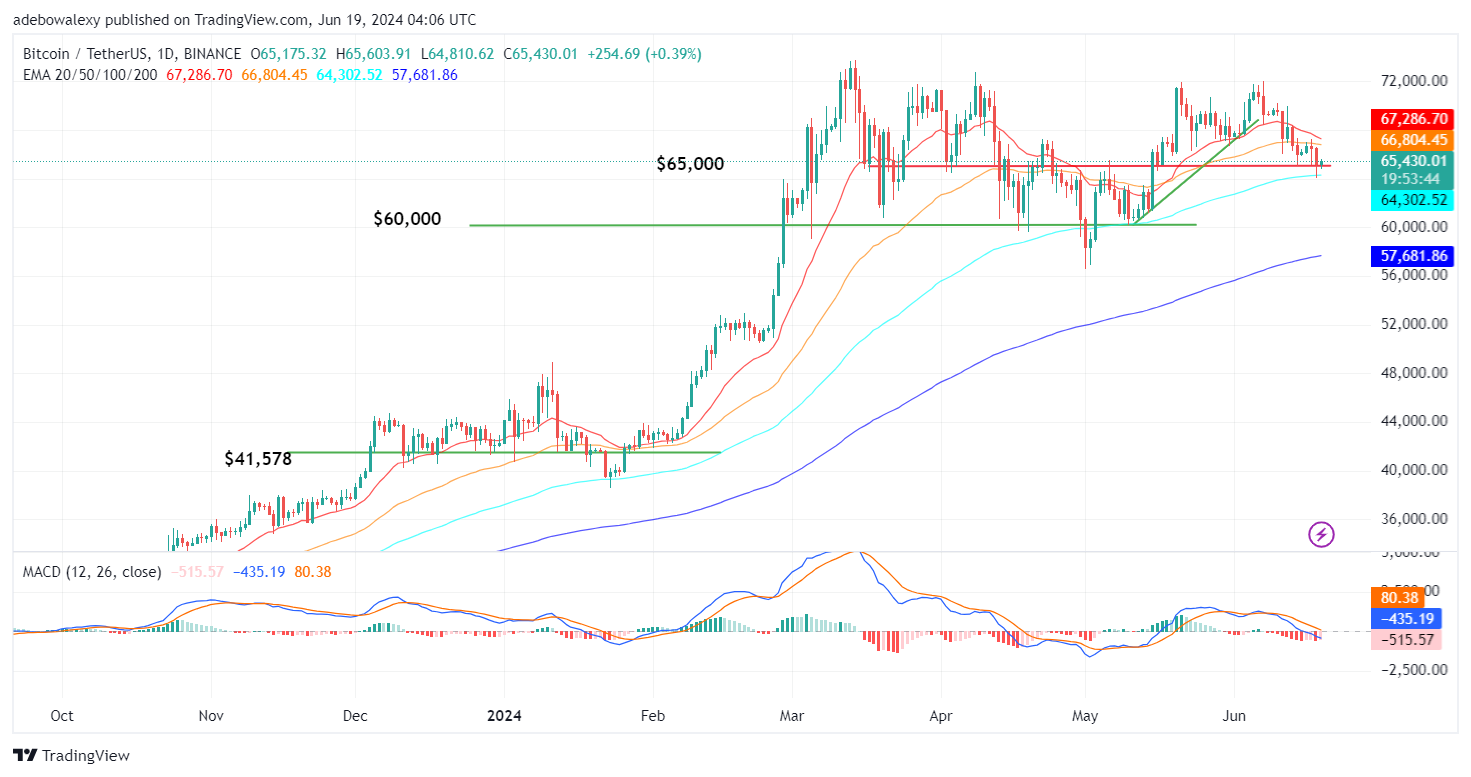
Trading activity in the Bitcoin daily market can be spotted occurring above the $65,000 mark. The coin’s price action now lies between the 20, 50, 100, and 200-day Exponential Moving Average (EMA) lines. Meanwhile, the Moving Average Convergence Divergence (MACD) indicator lines have fallen below the equilibrium level. Although the line has not shown any deflection in its path, the last bar of the indicator can now be seen appearing pale red. This suggests that an upside correction may be in its infancy.
Bitcoin Price Prediction: BTC/USDT Sees Only a Slight Rrcovery
Given that price action is now appearing above the medium-term support at the $65,000 price level, one can say that the market is making a nice recovery. The last price candle can now be seen appearing green above the $65,000 mark. The market still lies between the EMA lines, indicating that upside expectations are well-grounded at this point.
Furthermore, the MACD lines are still trending downward after crossing below the equilibrium level. This can be seen as the last bars of the indicator appear pale red. This affirms that upside forces may be developing but haven’t gained much ground to make a significant impact yet.
BTC/USDT Medium-term Trend: Bitcoin’s Upside Correction Is Quite Minimal at an Initial Point (4H Chart)
The 4-hour Bitcoin market has revealed how price action has recovered from headwinds. Price action punched through the $65,000 mark two sessions ago. The appearance of the corresponding price candle to the previous session suggests that price action may have found support at the $65,000 mark. The ongoing session has only presented minimal price increases, keeping the coin trading below all the EMA lines at this point.
The MACD lines can also be seen converging for an upside crossover just below the equilibrium level. Indications from both the daily and 4-hour markets suggest that upside forces are still up against significant opposition. This may restrain any further upside corrections, as downward forces remain dominant. The only saving grace is if buyers rally behind price action from this point on. Consequently, this will push the market to gain more traction towards the $70,000 price level.