Litecoin (LTC) Price Prediction: LTC/USDT Downward Correction Gains Momentum
Estimated Reading Time: 3 minutes
Don’t invest unless you’re prepared to lose all the money you invest. This is a high-risk investment and you are unlikely to be protected if something goes wrong. Take 2 minutes to learn more
Litecoin (LTC) Price Prediction: June 18
Headwinds had earlier prevailed in the Litecoin daily market. This caused price action to experience a bearish breakout of the symmetrical triangle trading pattern. Afterward, the market consolidated within a narrow price range before diving deeper as seen in today’s trading activity with significantly increased momentum.
LTC/USDT Long-term Trend: Bearish (Daily Chart)
Key Price Levels:
Resistance Levels: $80, $90, and $100
Support Levels: $70, $60, and $50
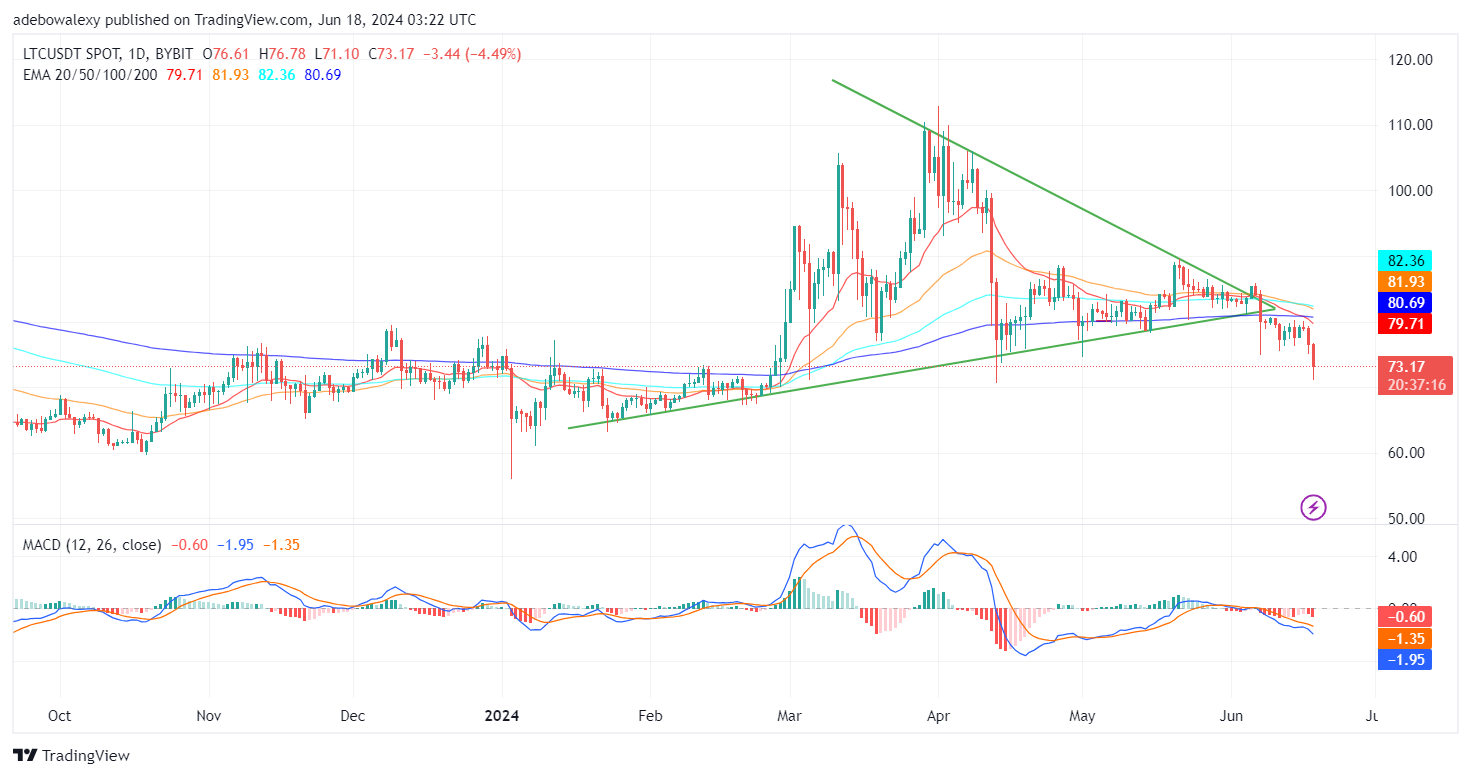
Price action in the Litecoin daily market has fallen below the technical price level of the $75.00 mark. Consequently, this implies that the market has proceeded further below the technical support at the $80.00 mark. Also, trading activity is now below all the Exponential Moving Average (EMA) curves. Furthermore, the Moving Average Convergence Divergence (MACD) has taken on a more bearish trajectory below the equilibrium level. Meanwhile, the bars have been appearing solid red for about two sessions.
Litecoin Price Prediction: LTC/USDT Is Under Bearish Pressure
The Litecoin market has broken free from a short-term consolidation since the previous session; only today’s trading activities have further strengthened bearish holds on the market. The last candle on the chart can be seen at a significant distance below the EMA lines.
Although the ongoing session is revealing that upside forces are already fighting back through the appearance of the lower shadow on the price candle, headwinds seem to have made significant progress. The display on the MACD has only shown that price action is still under the influence of headwinds, and this threatens to drive the market lower. As a result, it appears that price action may soon hit technical support at the $70 mark.
LTC/USDT Medium-term Trend: Litecoin Downward Seems Quite Volatile (4H Chart)
The LTC 4-hour market shows that ever since price action broke the support at the $76.90 mark, headwinds were able to gain a strong grip on the market. However, the latest session has seen the most significant price decline. This brought the market down through the psychological price levels of $76 and $75. Although the last price candle on the chart lies below all the EMA lines, we can see that there has been a considerable retraction via the appearance of a lower shadow on the last price candle.
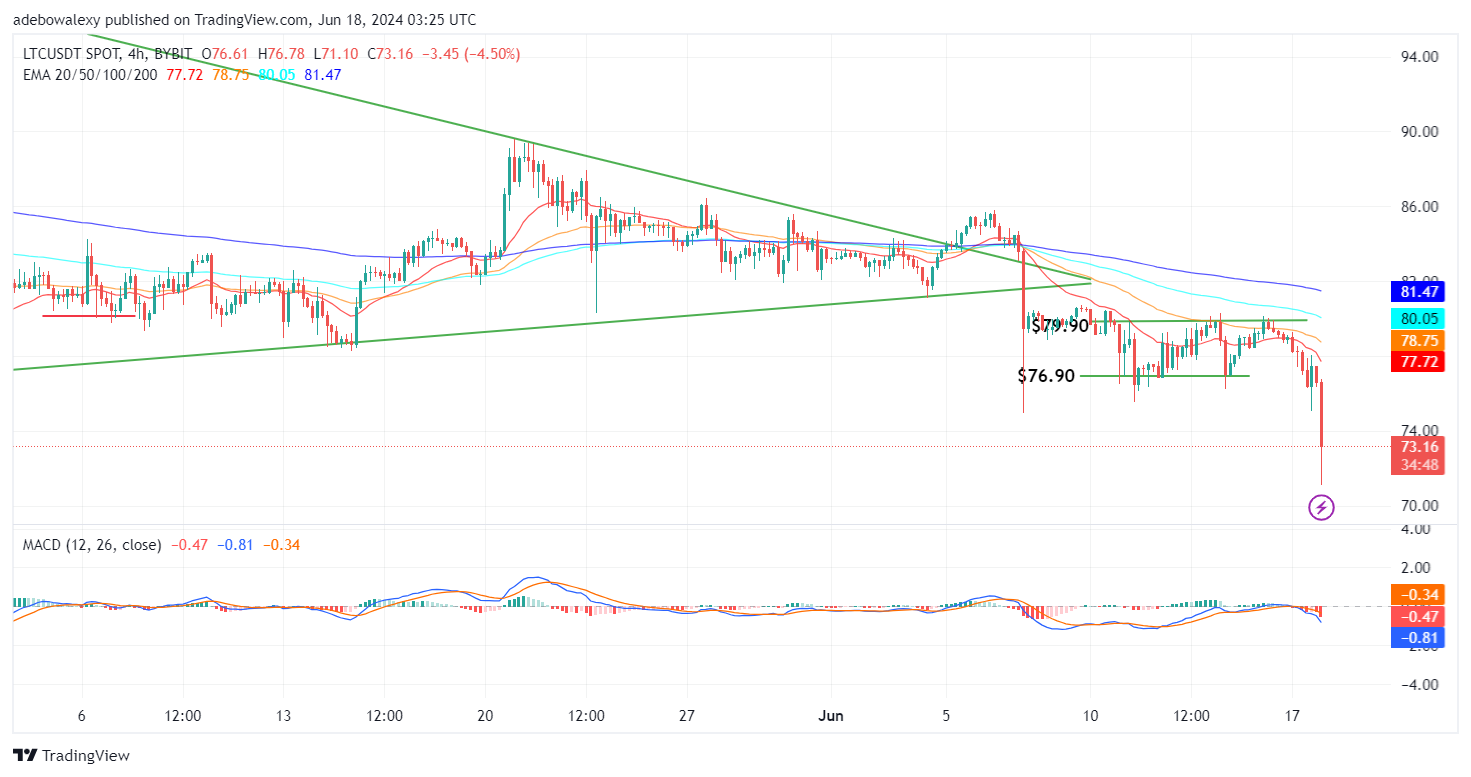
Also, the MACD lines are below the equilibrium level. Similar to the solid red appearance on the indicator’s bar on the daily chart, the same has appeared here. Therefore, this suggests that headwinds are in a position to drive the market lower. Consequently, traders can still expect the downward correction to hit the $70 mark.