Dogecoin (DOGE) Price Prediction: DOGE/USDT Is Marching on Below the $0.1400 Mark
Estimated Reading Time: 3 minutes
Don’t invest unless you’re prepared to lose all the money you invest. This is a high-risk investment and you are unlikely to be protected if something goes wrong. Take 2 minutes to learn more

Dogecoin (DOGE) Price Prediction: June 17
After price movement in the Dogecoin daily market defied the drawn upside-sloping trendline, the market proceeded toward lower price marks. The market broke through the $0.1400 mark and now trades below it. Even then, bears maintain their threatening look.
DOGE/USDT Long-term Trend: Bearish (Daily Chart)
Key Price Levels:
Resistance Levels: $0.1400, $0.1600, and $0.1800
Support Levels: $0.1300, $0.1100, and $0.0900
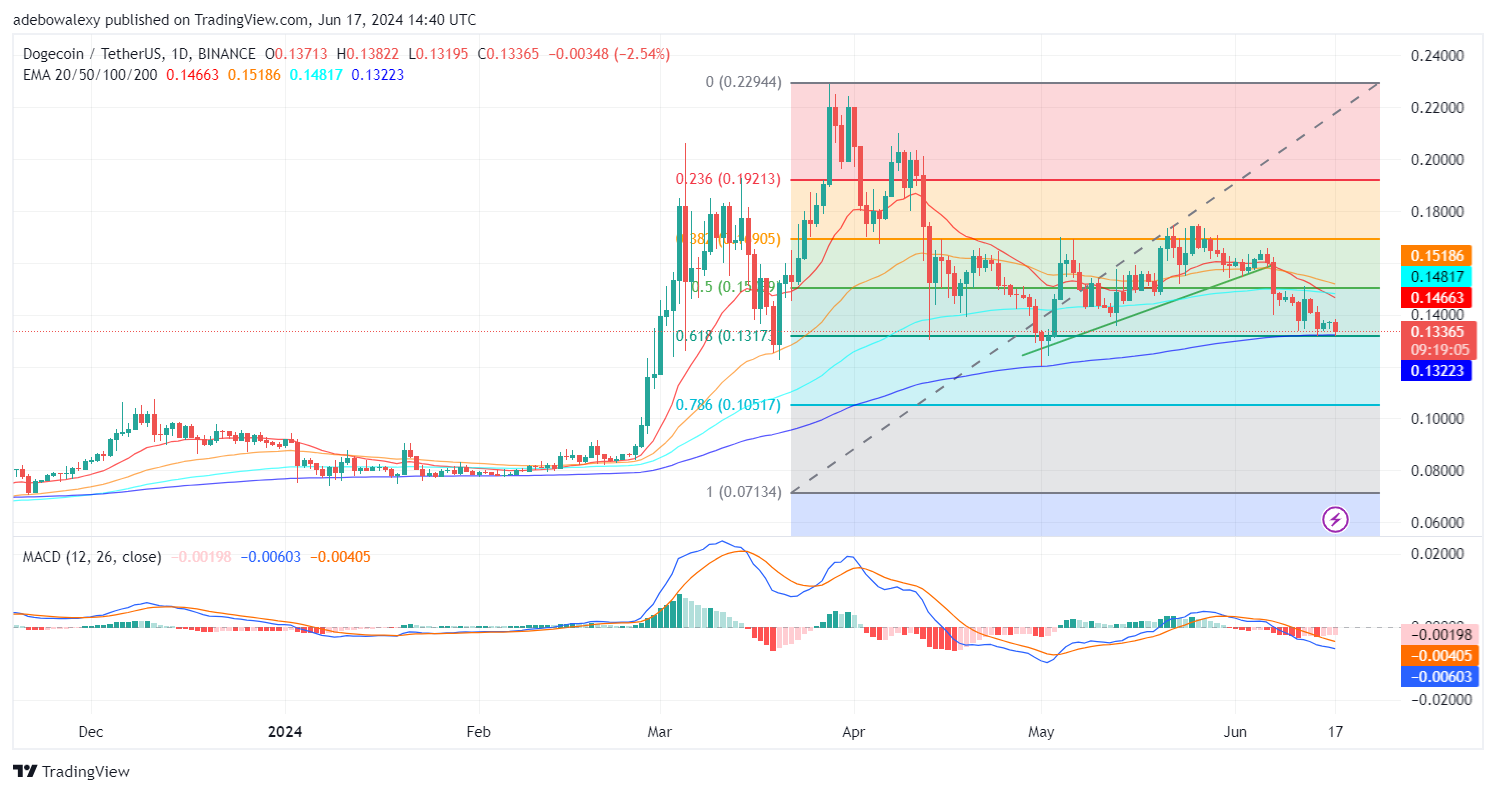
The current session can be seen on the daily price chart below the technical price level of $0.1400. Consequently, Dogecoin now trades below most of the Exponential Moving Average (EMA) lines. Also, the Moving Average Convergence Divergence (MACD) curves are proceeding below the equilibrium level. However, the bars of this indicator are now pale red, which indicates that headwinds are weak and may be overcome at any time.
Dogecoin Price Prediction: DOGE/USDT Price Movement Seems Hard to Predict
Considering the territory where Dogecoin is trading, one can assume that the market is bearish for the most part. However, the appearance of the MACD indicators suggests that upside forces can easily overcome the downward ones. This opinion stems from the pale red appearance of the indicator bars.
Additionally, the lines of the MACD continue downward below the equilibrium level, and there isn’t any sign of deflection between the indicator lines. However, the pale appearance of the MACD bars cannot be overlooked since it implies that a favorable impetus may change the market’s direction. So traders should stay attentive to this market for such impetus while maintaining a bearish stance in the meantime.
DOGE/USDT Medium-term Trend: Dogecoin Displays Inverted Bullish Reversal Signs (4H Chart)
Similar to what has been seen in the Dogecoin daily market, price activity in the DOGE/USDT 4-hour market has continued downward even on a 4-hour chart. The last two price candles on this chart resemble a tweezer pattern. Technically, this would have signaled a trend reversal. However, the appearance of a bullish reversal tweezer on this chart seems reversed.
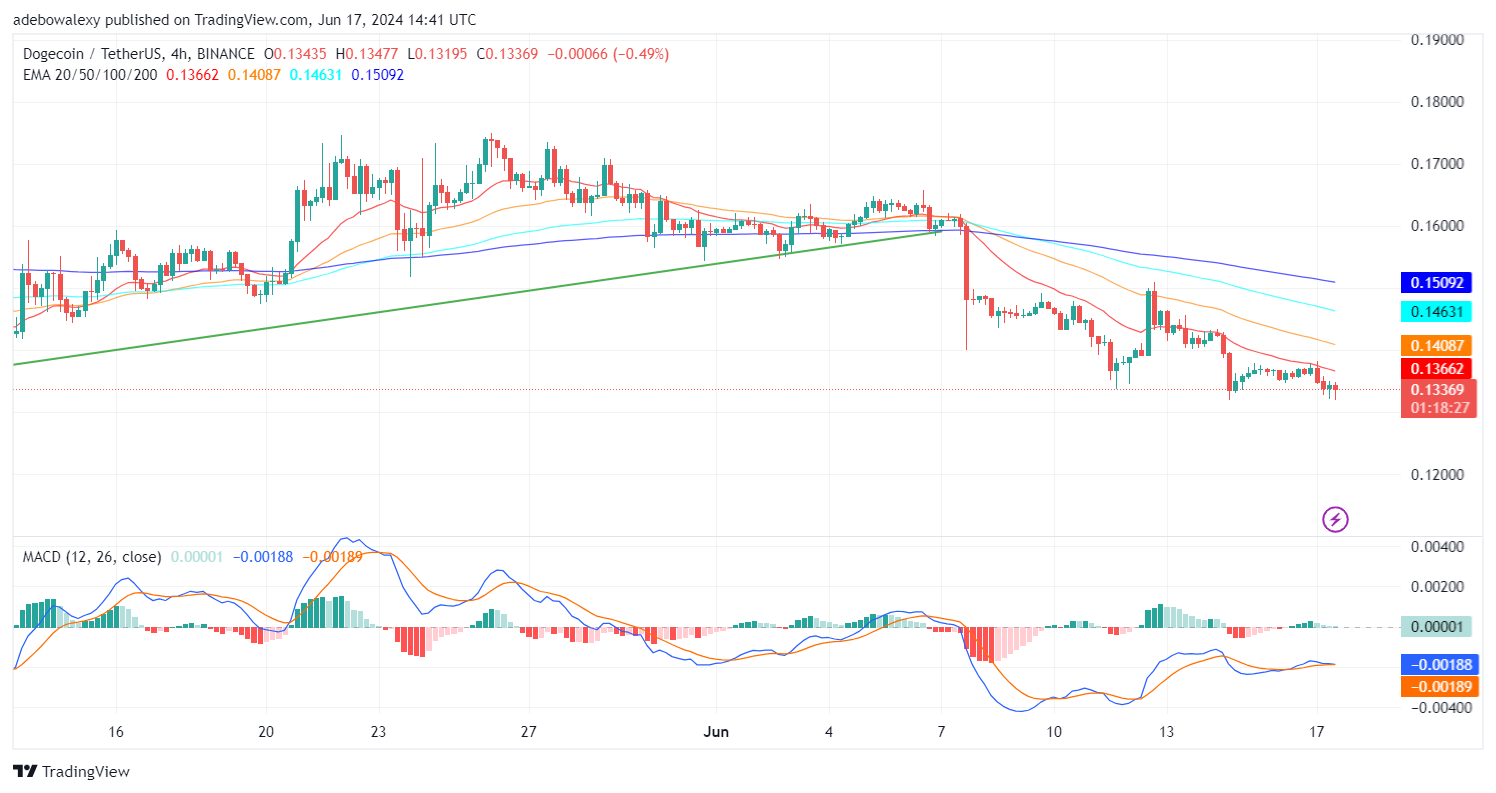
In addition, price action in the market is now below all the EMA lines, which confers strong bearish characteristics on the market. The MACD lines can be seen below the equilibrium level and have merged as they trend sideways. This therefore dims hopes of a bullish reversal in this market. Consequently, traders can still expect the market to descend lower towards the $0.1300 level at least. Nevertheless, it will be good for them to stay attentive to the market-moving impetus concerning the pair.