Bitcoin Price Prediction: BTC/USD Bears May Slide Below $25,000 Support
Estimated Reading Time: 3 minutes
Don’t invest unless you’re prepared to lose all the money you invest. This is a high-risk investment and you are unlikely to be protected if something goes wrong. Take 2 minutes to learn more
Bitcoin Price Prediction – August 22
The Bitcoin price prediction shows that BTC is likely to cross below the lower boundary of the channel as the coin touches $25,350 support.
BTC/USD Long-term Trend: Ranging (Daily Chart)
Key levels:
Resistance Levels: $30,000, $32,000 $34,000
Support Levels: $22,000, $20,000, $18,000
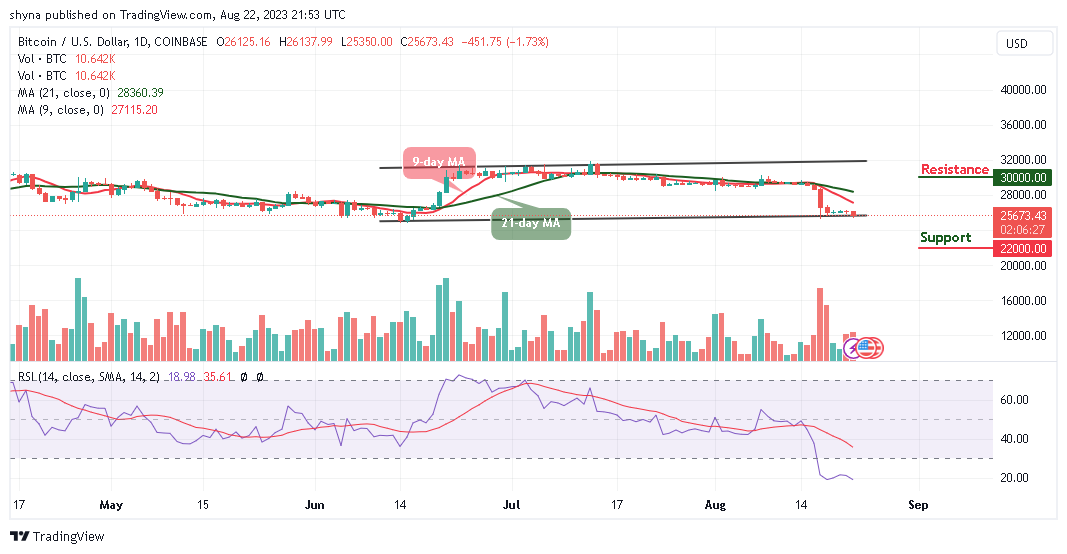
BTC/USD may continue to face a setback that could drag the coin below the lower boundary of the channel, and the king coin is likely to have an additional bearish run. Currently, Bitcoin (BTC) is trading around the $25,673 level after a free fall from the opening price of $26,126.
Bitcoin Price Prediction: Bitcoin (BTC) Heads to the Downside
The Bitcoin price is currently nose-diving below the moving averages. If the price should slump below the support level of $25,000, it is likely to face a downward trend. Moreover, the further bearish movement could locate the supports at $22,000, $20,000, and $18,000, making room for BTC to fall even further.
In the meantime, the technical indicator Relative Strength Index (14) remains within the oversold region as the trading volume is in support of the bears. On the contrary, if bulls decide to move the price back above the 9-day and 21-day moving averages, BTC/USD may head toward the upper boundary of the channel to locate the resistance levels at $30,000, $32,000, and $34,000.
BTC/USD Medium-term Trend: Bearish (4H Chart)
On the 4-hour chart, the Bitcoin price remains below the 9-day and 21-day moving averages and the immediate support is likely to come at the $25,000 level. The price may likely fall below this level if the bears continue to dominate the market.
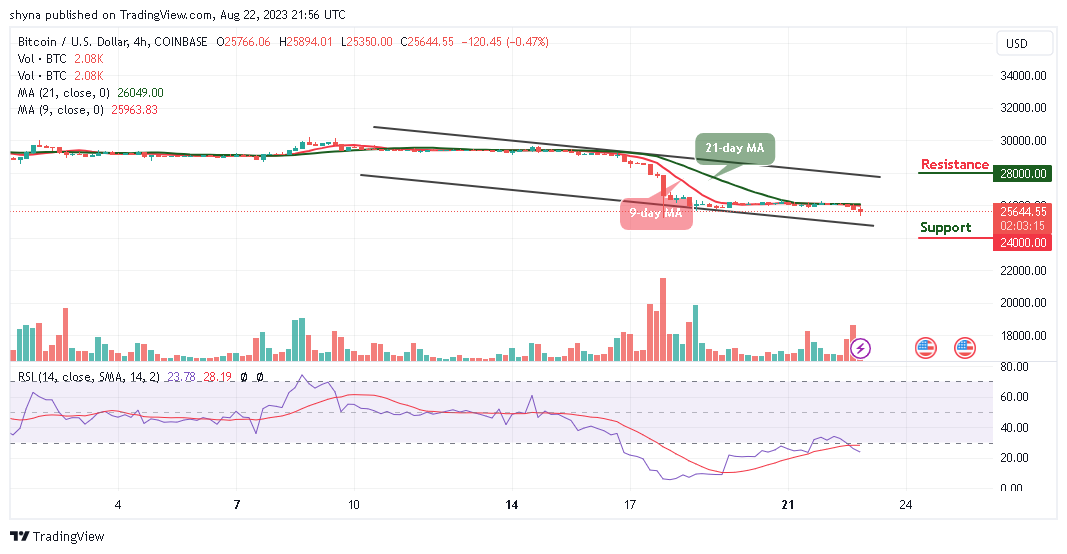
However, a further bearish movement could hit the critical support at the $24,000 level and below, while the resistance is located above the moving averages at the resistance level of $28,000 and above. Meanwhile, the Bitcoin price is currently moving on the negative side as the technical indicator Relative Strength Index (14) stays within the oversold region, suggesting more bearish signals.
You can purchase Bitcoin here. Buy BTC