0x (ZRXUSD) Long Term Consolidation to Continue
Estimated Reading Time: 2 minutes
Don’t invest unless you’re prepared to lose all the money you invest. This is a high-risk investment and you are unlikely to be protected if something goes wrong. Take 2 minutes to learn more
ZRXUSD Key Zones
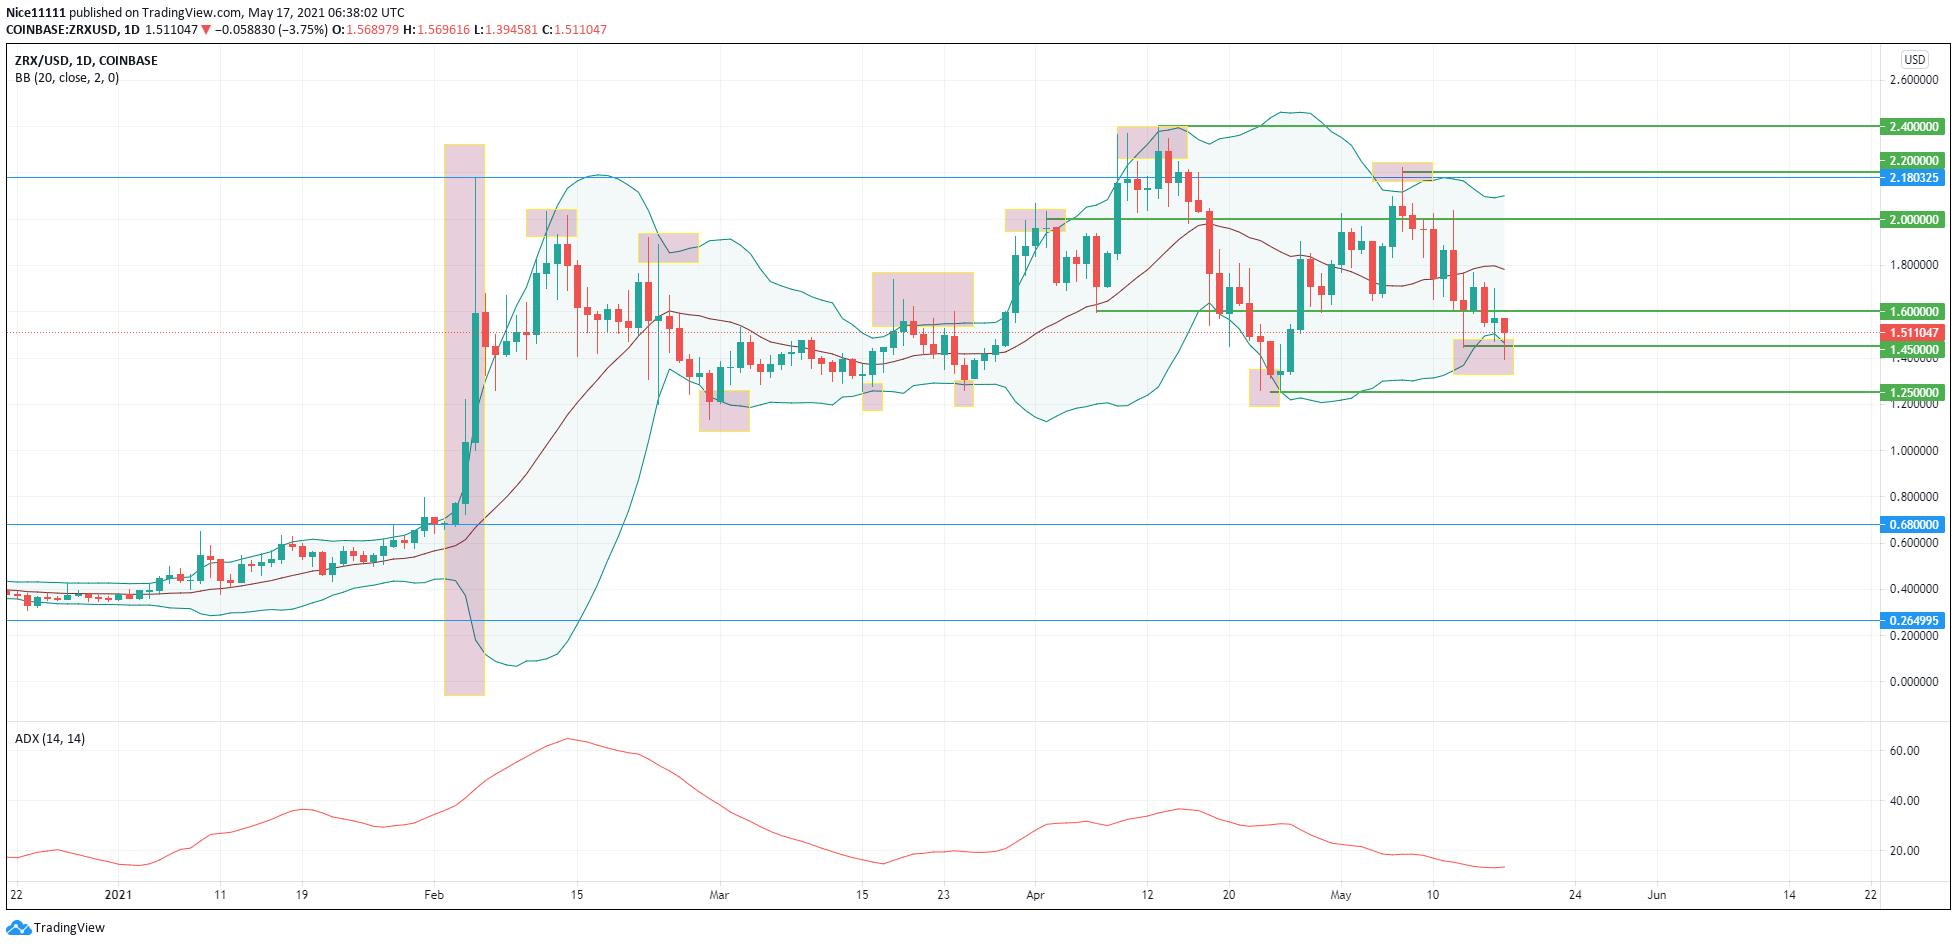
Demand Zones: 1.25, 1.45, 1.60
Supply Zones: 2.00, 2.20, 2.40
ZRXUSD experienced a very volatile pump on the 3rd of February. Price aggressively rallied from 0.68 to 2.18 within three days before the price dropped. Price has henceforth moved in a sideway direction, and it has been ranging with no clear cut direction.
The Bollinger Bands show the range of the market as the candles touch both sides of its borders. Price bounces across both borders without staying just on a side of the Bollinger Bounce The highest point of the range is at 2.40 and the lowest part is at 1.30.
On the daily chart, the ADX (Average Directional Index) is at 13.54 as at the time of writing which shows complete weakness in trends. The market range is very obvious.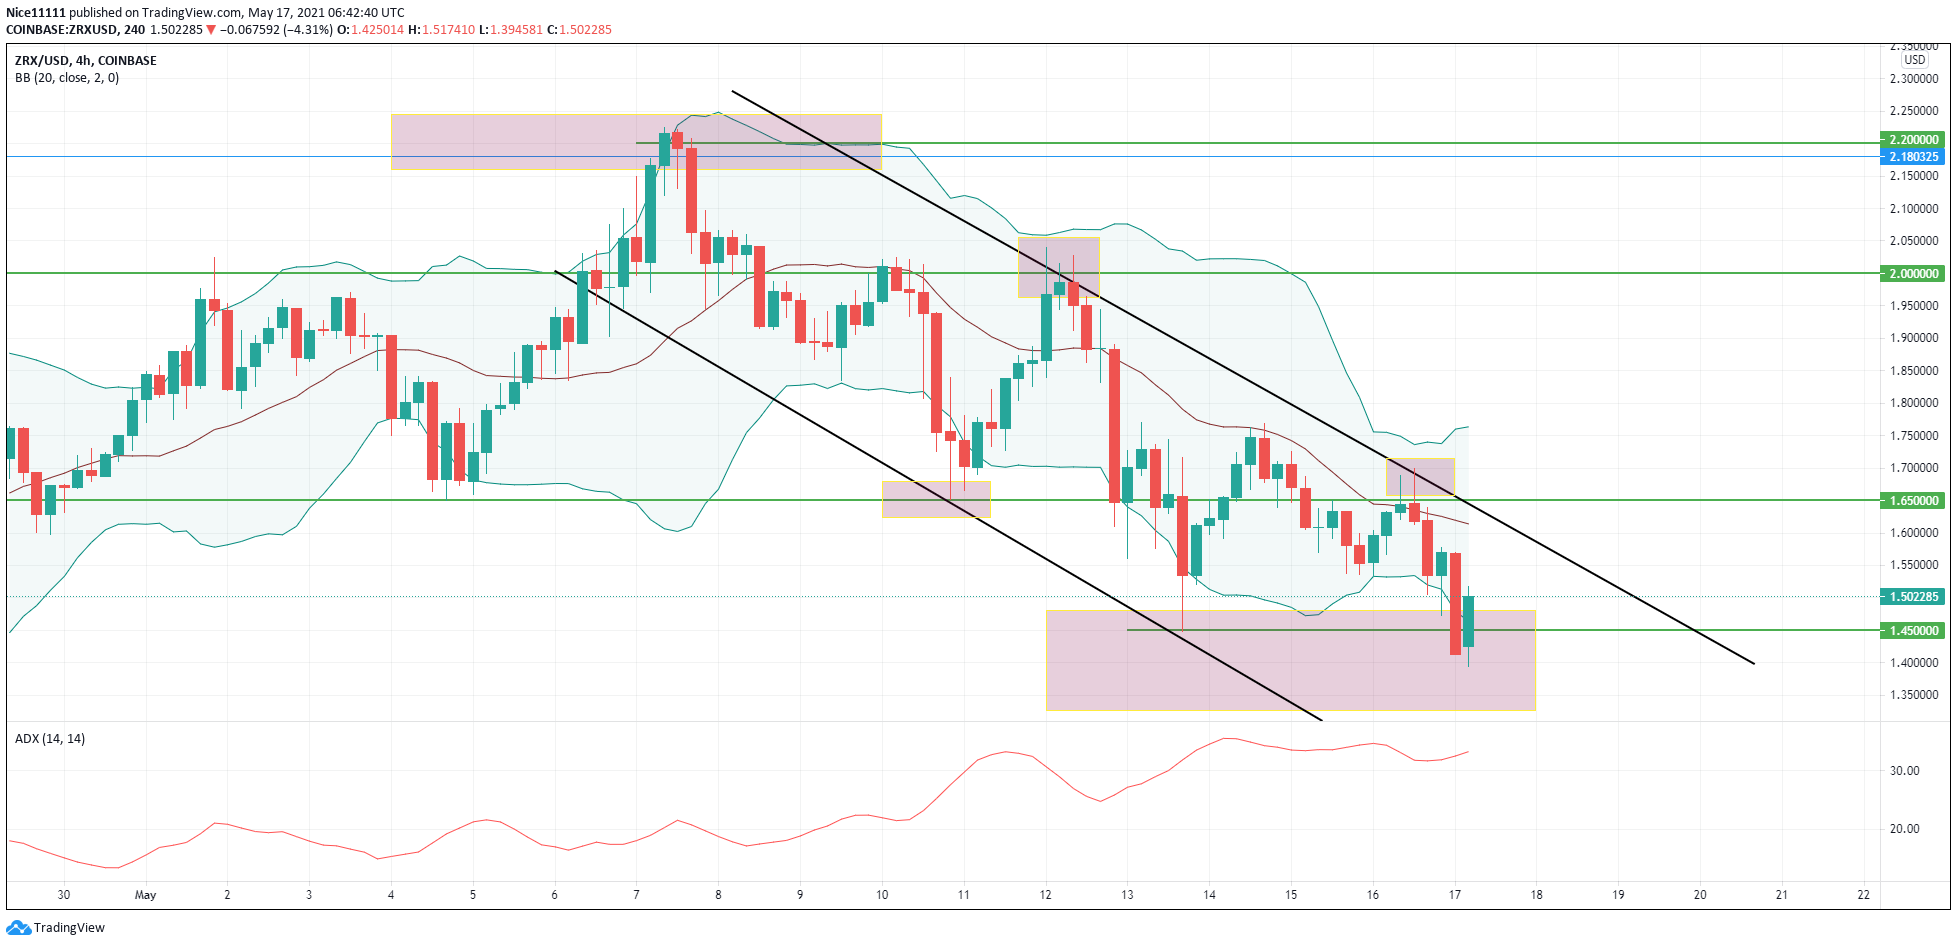
On the four-hour chart, 0x is trending gently. This is seen with the descending channel as lower lows and lower highs are formed. The Bollinger Bands also show price bearish run as no single candle successfully touched the upper borders of the Bollinger band after the trend change on the 7th of May.
The ADX is currently at 33.28 which shows the gentle trend on the chart. ZRX currently is on a support zone at 1.45. Price might drive through the zone to reach for lower support at 1.25. ZRXUSD might also bounce up to the border of the descending channel to continue falling.
Within the range still lies trading opportunities of buying low and selling high. Some other traders might just wait to see a trending market based on their trading style.
Note: cryptosignals.org is not a financial advisor. Do your research before investing your funds in any financial asset or presented product or event. We are not responsible for your investing results.