Solana (SOL/USD)Market Features Lower Lows in $20 and $10
Estimated Reading Time: 3 minutes
Don’t invest unless you’re prepared to lose all the money you invest. This is a high-risk investment and you are unlikely to be protected if something goes wrong. Take 2 minutes to learn more
Solana Price Prediction – December 3
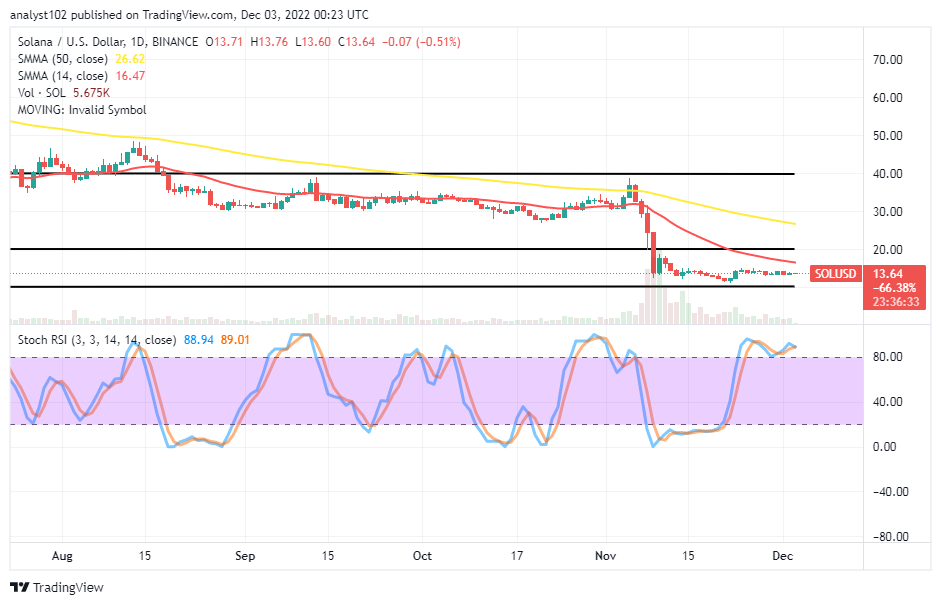
There has been a reduction in the SOL/USD market bulls’ trending ability as the crypto market features lower lows in the $20 and $10 trading zones over a couple of sessions. As of the time of writing, price exchanges hands around $13.64 at a minute average negative percentage rate of 0.51.
SOL/USD Market
Key Levels:
Resistance levels: $20, $25, $30
Support levels: $10, $7.50, $5
SOL/USD – Daily Chart
The SOL/USD daily chart showcases that the crypto market features lower lows in the $20 and $10 trading levels against the US Dollar. The 14-day SMA indicator is at a 16.47 value line above the $26.62 point of the 50-day SMA indicator. The horizontal lines drawn to mark the upper and the lower range lines price has been The Stochastic Oscillators have moved into the overbought region, denoting the possibility of the crypto trade not having much-required energy to push northward more sustainably.
Will the SOL/USD trade have a higher possibility of moving south and leaving the $10 lower range?
As the SOL/USD market operation features lower lows in the $20 and $10 range zones, it is that reading of the Stochastic Oscillators that the crypto trade risks the probability of going downward based on the current status of catalysts it has lost. However, the going down potency may not last before buyers’ reactions are attracted to give back a breath into the while price dips.
On the downside of the technical analysis, the SOL/USD market bears may have to be on the lookout for the price to test resistance around the 14-day SMA trend line and the upper range barrier line before opting for a shorting order afterward. Technically notable, the activities between long-position and short-position placers tend to continue in the same vein, causing some levels of indecision to play out more in the subsequent transaction trading days.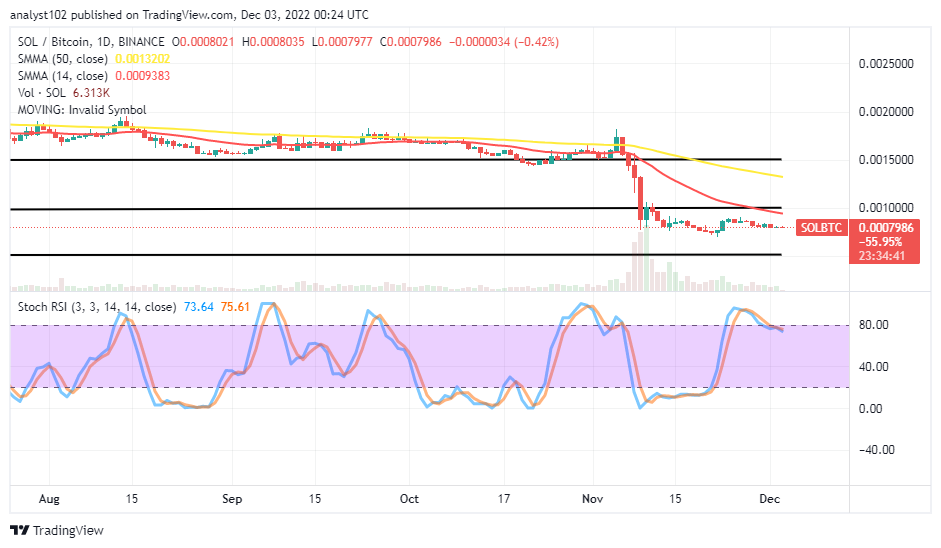
SOL/BTC Price Analysis
In comparison, Solana has been debasing to a continual condition as it features lower lows in definite lower range-bound zones against the trending ability of Bitcoin over time. The 14-day SMA trend line has traveled southward apart from the 50-day SMA trend line into the range-trading spots. At levels 75.61 and 73.64, the Stochastic Oscillators positioned north of the overbought area. That shows the pairing crypto market may not quickly leave out of the range zones, especially the upper side depicted at B0.001.
Note: Cryptosignals.org is not a financial advisor. Do your research before investing your funds in any financial asset or presented product or event. We are not responsible for your investing results.
You can purchase Lucky Block here. Buy LBLOCK