Polygon (POL) Price Prediction: POL/USDT Hits Solid Ground
Estimated Reading Time: 3 minutes
Don’t invest unless you’re prepared to lose all the money you invest. This is a high-risk investment and you are unlikely to be protected if something goes wrong. Take 2 minutes to learn more

Polygon (POL) Price Prediction: June 16
Price action in the Polygon daily market appears to have hit the lowest possible level during the past two trading sessions. Since then, price action has rebounded upwards through yesterday’s session, while today has presented minimal downward corrections so far.
POL/USDT Long-term Trend: Bearish (Daily Chart)
Key Price Levels:
Resistance Levels: $0.7000, $0.8000, $0.9000
Support Levels: $0.6000, $0.5000, $0.4000
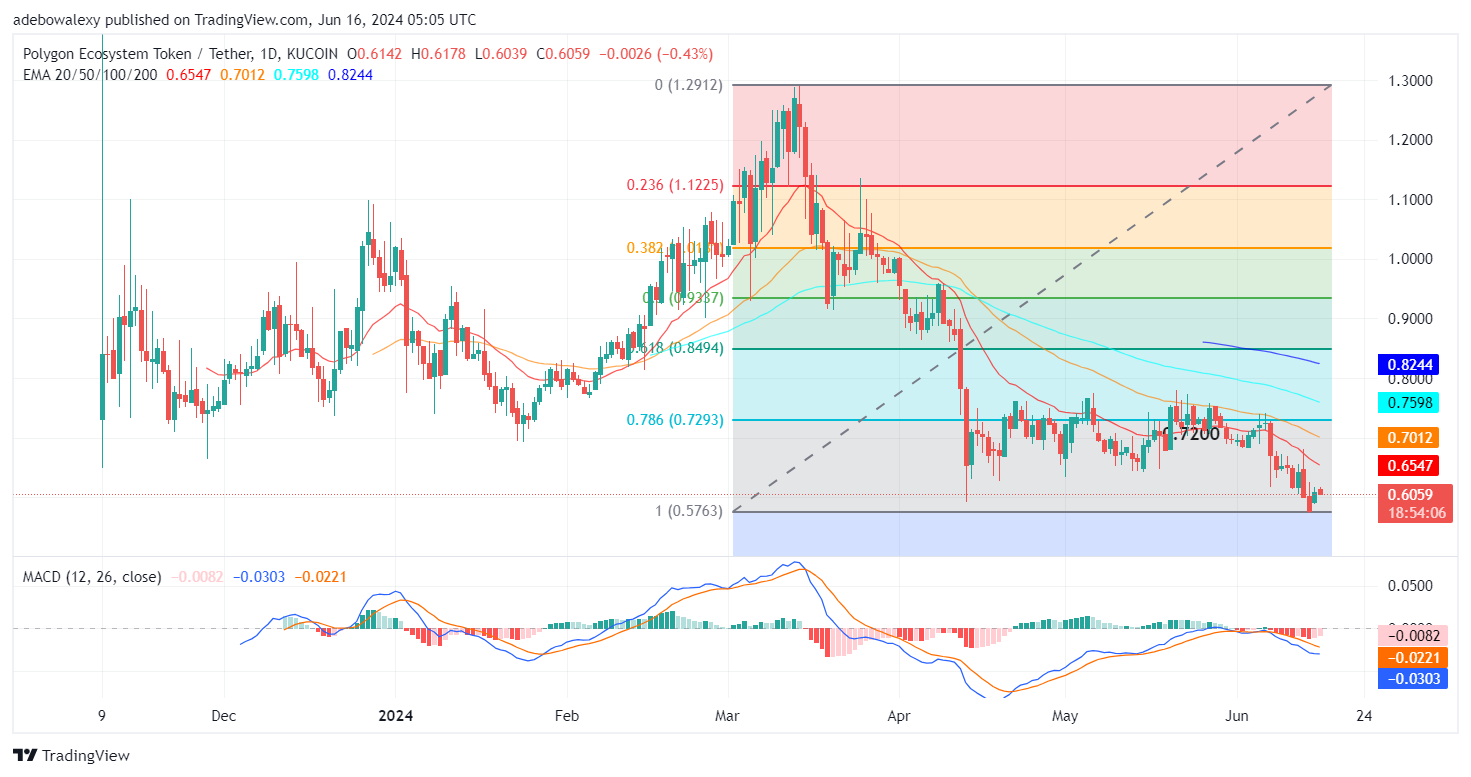
Trading activity in the Polygon market has fallen below the 20-day Exponential Moving Average (EMA) curve. Consequently, this implies that price action in the market is now below all the EMA lines. Meanwhile, the market can be seen rebounding off the support formed by the lowest level of the Fibonacci Retracement level at 1. Be that as it may, the MACD indicator is showing signs of decreased downward momentum, as its bars are now pale red below the equilibrium level and are getting shorter. The price candles representing the previous session and the past two sessions seem to be forming a bullish engulfing pattern.
Polygon Price Prediction: A Bullish Reversal Is Suspected in the POL/USDT Market
While bearish indicators seem more prevalent in the POL/USDT market, a significant sign of a bullish reversal can also be spotted. This market has rebounded off Fibonacci Retracement Level 1 Since then, the market has maintained a general upside path.
Although the token now trades below all the EMA lines on a daily chart, we can see that the bars of the MACD indicator are now appearing pale red, which shows that downward forces may be giving way to upside ones. Consequently, this suggests that upside forces may be more active in this session and subsequent ones. This will then propel the market further upward.
POL/USDT Medium-term Trend: Polygon Continues to Show Upside Prospect Despite Setbacks (4H Chart)
Examining the Polygon token’s price action on a 4-hour market, we can see that the market has risen past the 20-day EMA line in the previous session. However, the current session on the chart has brought the market back below the indicator line. Nevertheless, price action stays closer to the mentioned indicator line. Despite this, the MACD indicator lines can be seen trending upwards, and its bars are solid green.
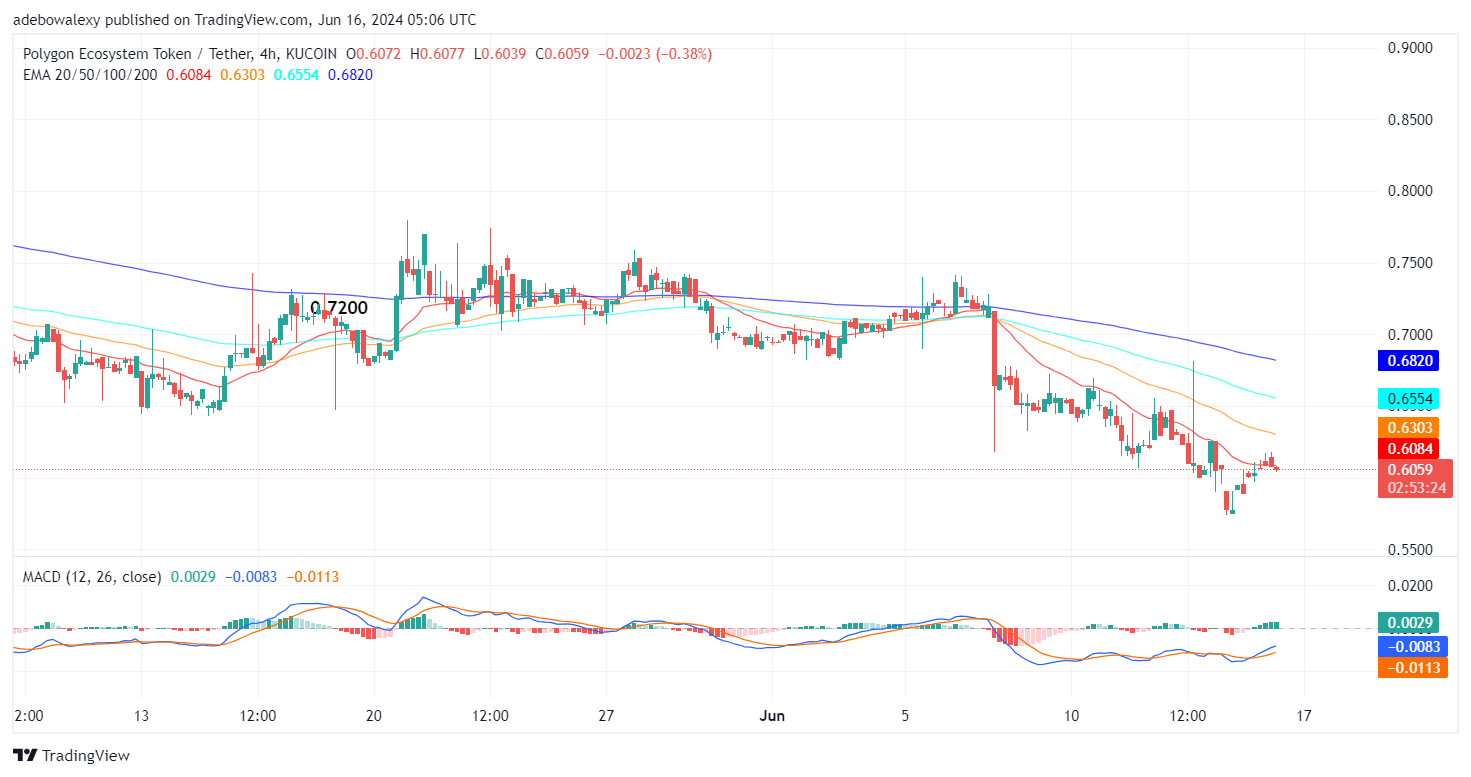
Technically, this aligns with the bullish reversal opinion stated above. Since price action is now closer to the EMA line, it appears more likely that upside forces will soon resume pushing the market upwards. Therefore, traders can still target the $0.7000 or other price marks not too far above the $0.7000 price level.


