Solana (SOL) Price Prediction: SOL/USDT Slumps Below the $150.00 Threshold
Estimated Reading Time: 3 minutes
Don’t invest unless you’re prepared to lose all the money you invest. This is a high-risk investment and you are unlikely to be protected if something goes wrong. Take 2 minutes to learn more

Solana (SOL) Price Prediction: June 14
Price activity in the Solana daily market has slumped below medium-term support at the $150 price level. Based on signals from trading indicators, it is likely that the market may head lower as trading continues.
SOL/USDT Long-term Trend: Bearish (Daily Chart)
Key Price Levels:
Resistance Levels: $150, $160, and $180
Support Levels: $140, $130, and $120
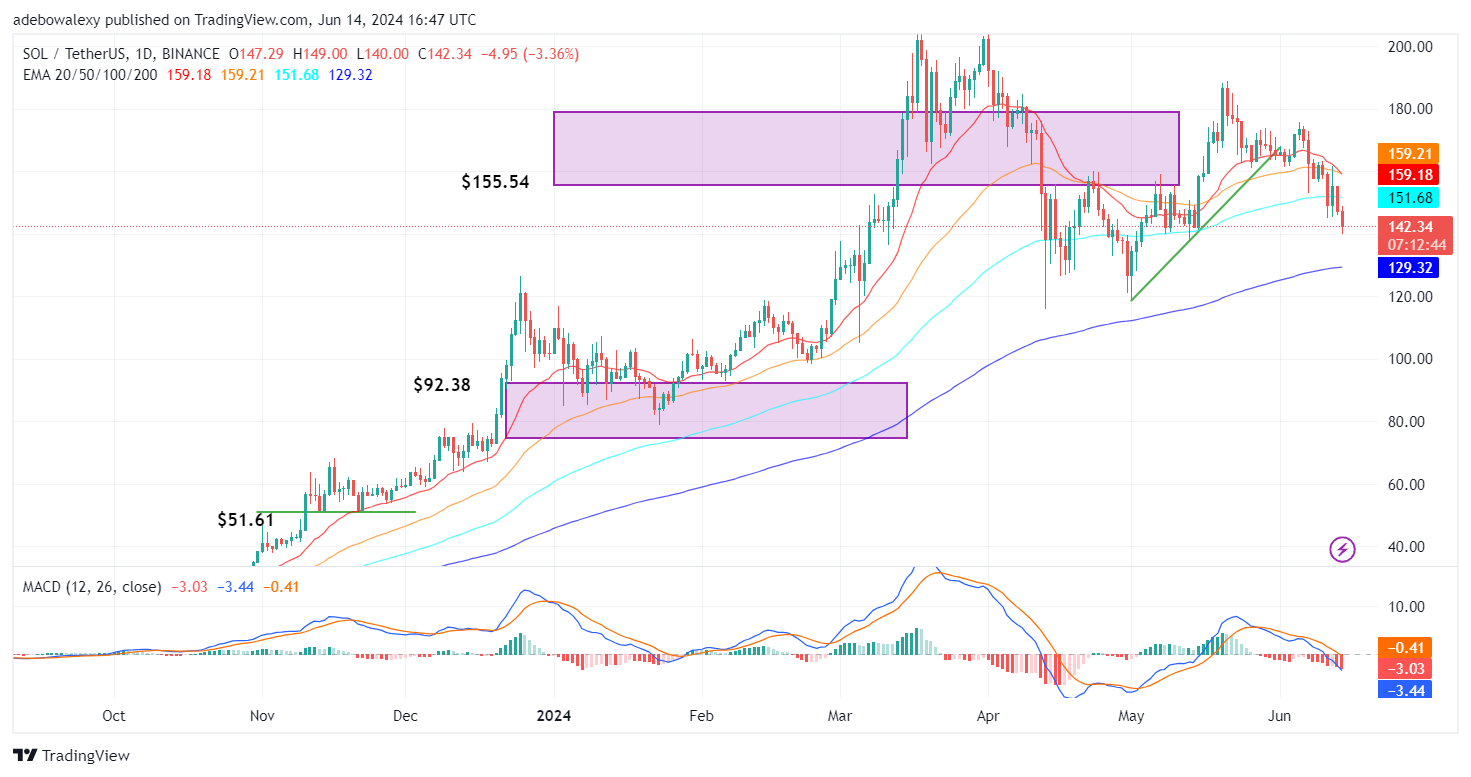
Solana’s price action has fallen below several technical landmarks that may aid bearish progress. Today’s trading activity has seen bears marching on with moderate momentum for the second consecutive session. At this point, the token is now trading below the 20, 50, and 100-day Exponential Moving Average (EMA) lines. Additionally, we can see that the Moving Average Convergence Divergence (MACD) lines are now below the equilibrium level. The last bar of the indicator also appears solid red.
Solana Price Prediction: SOL/USDT May Head Lower
Indicator signs from all the technical indicators on this price chart suggest that bears in the Solana market are taking over. It can be seen that price action has continued downward for four consecutive sessions. Additionally, the 20 and 50-day EMA lines can be seen converging for a downward crossover above price movement.
The ongoing session has proceeded below the 100-day EMA. Meanwhile, the MACD lines continue to indicate that bears are quite strong as the bars of the indicator below the equilibrium level get longer and remain solid red. Technically, participants should brace up, as price action may soon hit the technical support at the $140 mark.
SOL/USDT Medium-term Trend: Solana Market Maintains a Bearish Outlook (4H Chart)
In the SOL/USDT 4-hour market, it can be perceived that downward forces are still in the lead. The current session can be seen testing the technical support level at the $140 mark. Likewise, the session is occurring further below the EMA curves. However, the last price candle suggests that upside forces are besieging the mentioned technical support.
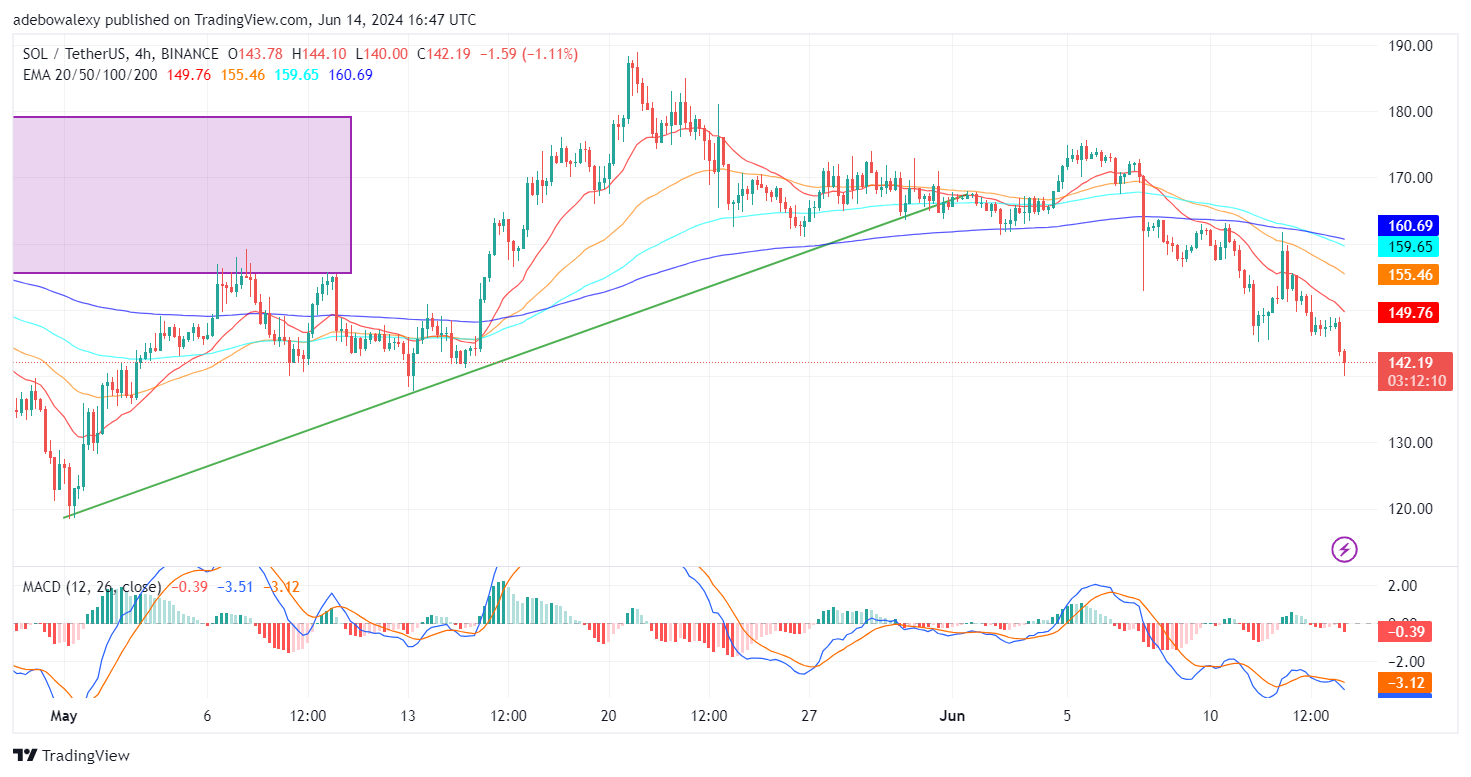
This is revealed by the appearance of a longer, lower shadow below the last price candle. However, the MACD lines have continued to trend downward below the equilibrium level. Therefore, this suggests that the market may still hit the technical support and approach the $135 price line.