Uniswap (UNI) Price Prediction: UNI/USDT Holds Tightly to Previous Profits
Estimated Reading Time: 3 minutes
Don’t invest unless you’re prepared to lose all the money you invest. This is a high-risk investment and you are unlikely to be protected if something goes wrong. Take 2 minutes to learn more

Uniswap (UNI) Price Prediction: June 13
The Uniswap daily market can be seen maintaining healthy fluctuations. Although this may be advantageous for price movement, it can be seen that the fluctuations have brought more negative results than positive ones.
UNI/USDT Long-term Trend: Bearish (Daily Chart)
Key Price Levels:
Resistance Levels: $10.00, $12.00, and $14.00
Support Levels: $8.00, $6.00, and $4.00
Price action since six sessions ago has been below the 50% Fibonacci Retracement level. Over the past two sessions, we can see that this Fibonacci retracement level has proved to be strong resistance as price action has kept rebounding off it promptly. At this point, the ongoing session has brought the price of the token downward, now just above the 20-day Exponential Moving Average (EMA) lines. The mentioned price candle can be seen having a longer lower shadow, hinting that upside forces have pushed back at headwinds in the session. Consequently, the Moving Average Convergence Divergence (MACD) lines are now moving sideways. Likewise, the bars of the MACD are now pale red, which aligns with the fact that downward forces are being resisted.
Uniswap Price Prediction: Uniswap Buyers Are Exerting Noticeable Influences on Price Movement
Since price action in the UNI/USDT daily market still lies above the EMA lines, it appears that bullish influences may receive more assistance from buyers. The appearance of the last price candle on the chart hints that upside forces are already acting. Additionally, the MACD indicator lines are now turning sideways from their previous downward trajectory, hinting that the tide may be turning against headwinds in the market.
Looking at the size of the last price candle on this chart, we can see that the previous upside rebound still outshines the downward correction seen in the ongoing session. Technically, it is reasonable to anticipate that the market may once again approach the ceiling at the 50% Fibonacci Retracement level. However, the question at this point is whether the market will rise through that ceiling.
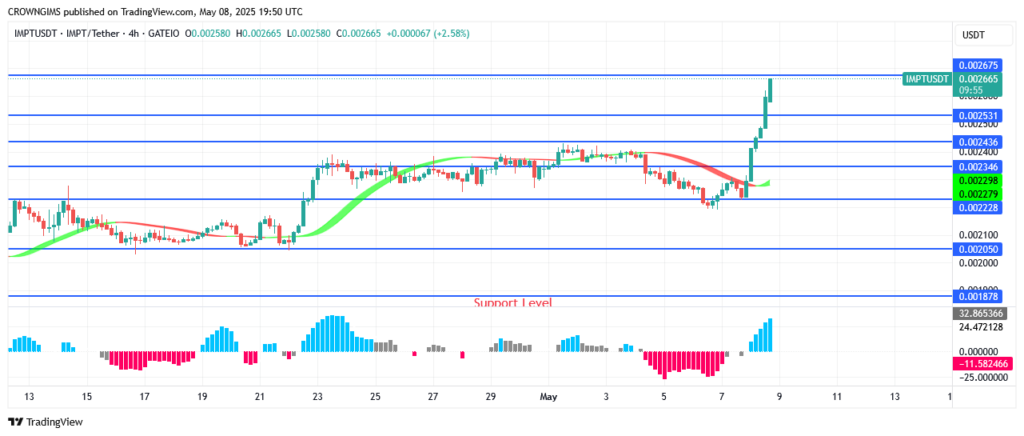
UNI/USDT Medium-term Trend: Uniswap Price Action Is Taking Off (4H Chart)
The Uniswap 4-hour market has further revealed that upside forces are pushing the market again. Since the previous session, we can see that price action has rebounded off the 20-day EMA curve. Although the 50-day EMA line now lies above price movement, the ongoing session can be seen proceeding in an upside direction. Meanwhile, the latest MACD indicator lines are still traveling upwards from below the equilibrium level, despite the pale appearance of the indicator bars.
Given the prevailing signs, it appears that upside forces are rising against all odds. However, this raises a question: for how long will upside forces be able to keep up? From the look of things, it is safe to say that the 50% Fibonacci level may still prove to be a strong resistance to further price increases in this market. Therefore, traders should consider gathering short-term positions towards the $10.40 mark.