Bitcoin (BTC) Price Prediction: BTC/USDT Bulls Make Impressive Recovery
Estimated Reading Time: 3 minutes
Don’t invest unless you’re prepared to lose all the money you invest. This is a high-risk investment and you are unlikely to be protected if something goes wrong. Take 2 minutes to learn more

Bitcoin (BTC) Price Prediction: June 12
Headwinds surged considerably in the previous session, bringing the market below the technical level at the $67,000 mark. However, today’s trading activity suggests that headwinds have only created a lower entry point for buyers, given the magnitude of the recorded price increase today.
BTC/USDT Long-term Trend: Bearish (Daily Chart)
Key Price Levels:
Resistance Levels: $70,000, $75,000, and $80,000
Support Levels: $65,000, $60,000, and $55,000
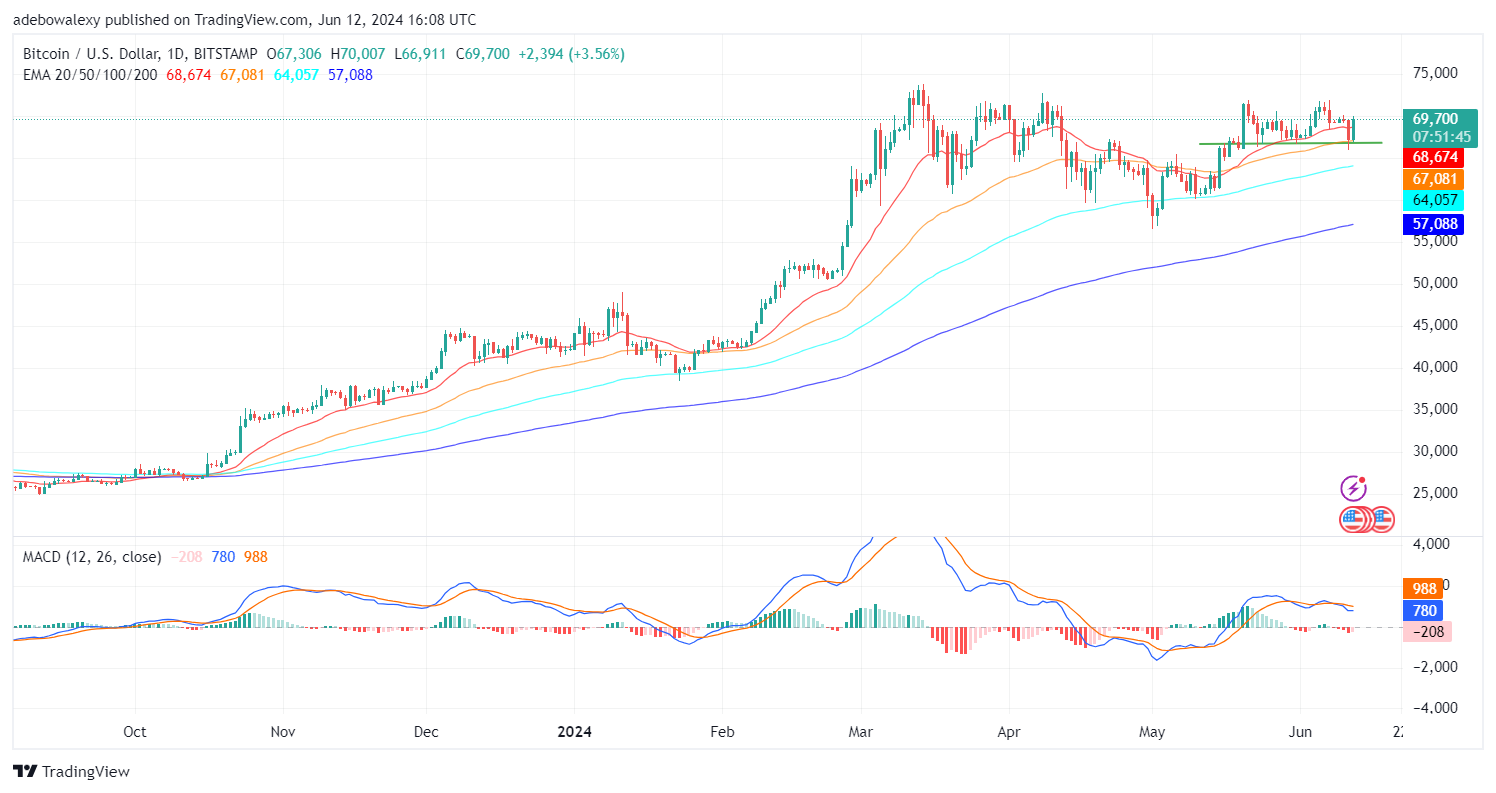
The BTC/USDT market saw price action tear through the support at the $67,000 mark. This can be seen through the lower shadow of the corresponding price candle to the previous session. Nevertheless, the last price candle here, which represents the ongoing session, has recorded a recovery greater than the losses seen in the previous session. At this point, Bitcoin resumes trading above the Exponential Moving Average (EMA) curve. Also, the Moving Average Convergence Divergence (MACD) indicator lines have taken a sideways bearing. Meanwhile, concerning the price increase in today’s trading activity, the last bar on the MACD has turned pale red on the daily chart.
Bitcoin Price Prediction: Bulls Are Hitting Hard at Bears in This BTC/USDT Market
The recorded price recovery in the Bitcoin daily market seems to be refocusing the market towards technical resistance. Although this isn’t the first time breaking that resistance in the past two to three months, breaking the price level at this point may yield more positive results for bullish traders. Price action in the BTC/USDT market has risen past the 20-day EMA line.
Since the mentioned EMA line lies above all the other EMA lines, it could imply that the market may trend further upwards. The market has been sealed below the psychological price level at the $70,000 mark for the past four sessions. Also, the MACD is hinting that upside forces may have the opportunity to push the market further upward since downward forces are now weaker. Additionally, the magnitude of the recovery posted by the last price candle suggests that upside forces may have just the needed momentum to break that mark.
BTC/USDT Medium-term Trend: Bitcoin Price Maintains High Potential to Rise Higher (4H Chart)
In the previous session on the BTC/USDT 4-hour market, it could be seen that buyers have a significant amount of influence at this point. The price level of $70,000 could be seen acting as a strong ceiling as price action corrected minimally off it in the ongoing session. Be that as it may, the market also stays above the EMA lines. Meanwhile, the MACD indicator lines can be seen proceeding slightly upwards following an upside crossover below the equilibrium level.
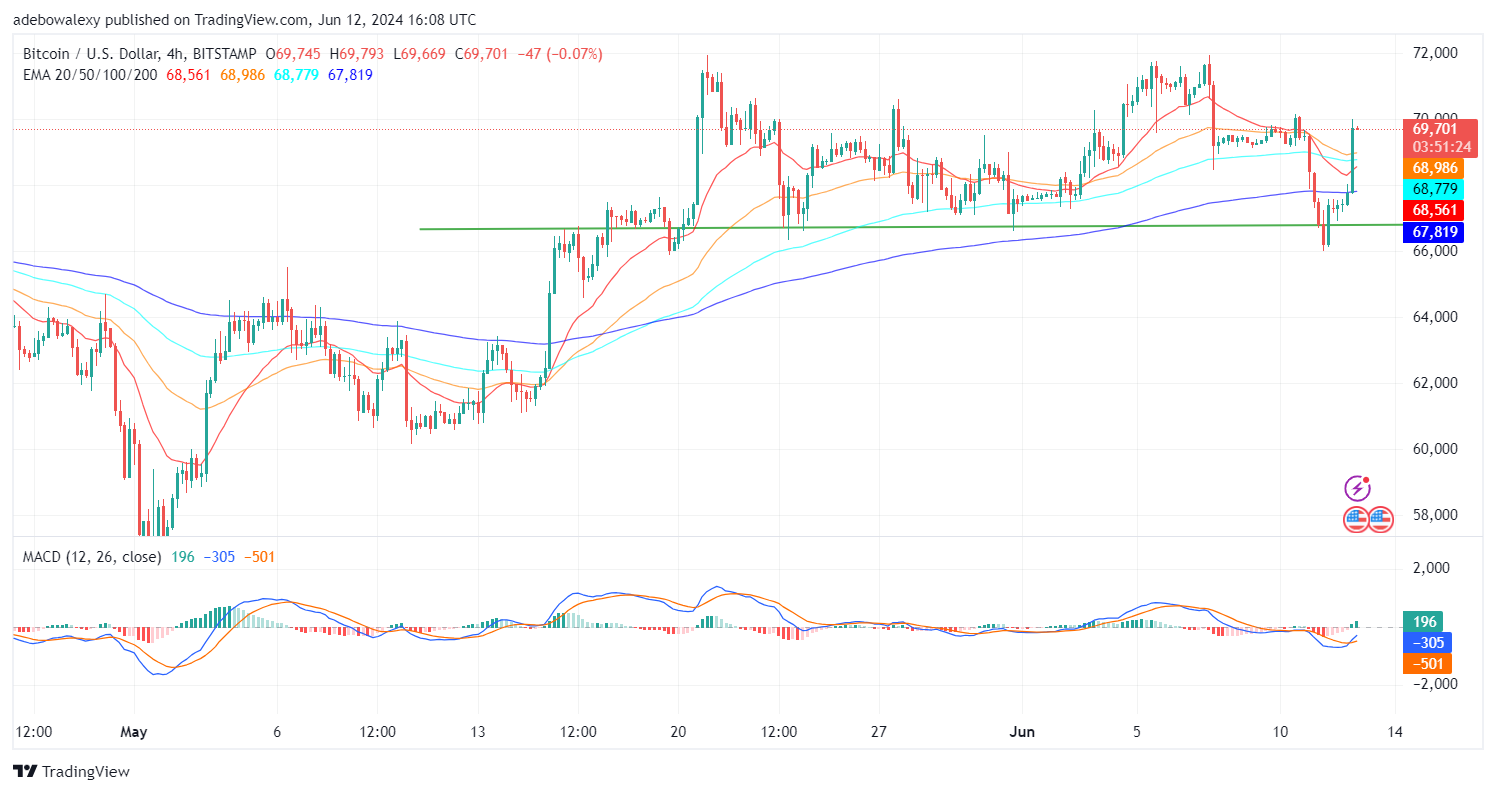
Indications arising from this market time frame still align with those of the daily chart. The only thing to worry about is the minimal price correction that occurred in the ongoing session. However, that correction seems too minimal to pose a significant threat considering the prevalent trend in the market. Therefore, market participants can anticipate a breaking of the resistance at $70,000, as the market may even attempt to obtain support above it for more price increases toward the $75,000 level.