Litecoin (LTC) Price Prediction: LTC/USDT Bullish Breakout Hits a Strong Headwind
Estimated Reading Time: 3 minutes
Don’t invest unless you’re prepared to lose all the money you invest. This is a high-risk investment and you are unlikely to be protected if something goes wrong. Take 2 minutes to learn more
Litecoin (LTC) Price Prediction: June 11
The Litecoin market had recently traded in a symmetrical triangle pattern. Subsequently, a bullish breakout occurred but was short-lived as the market spiraled downward afterward. Let’s further examine the market for more clues.
LTC/USDT Long-term Trend: Bearish (Daily Chart)
Key Price Levels:
Resistance Levels: $80.00, $85.00, and $90.00
Support Levels: $75.00, $70.00, and $65.00
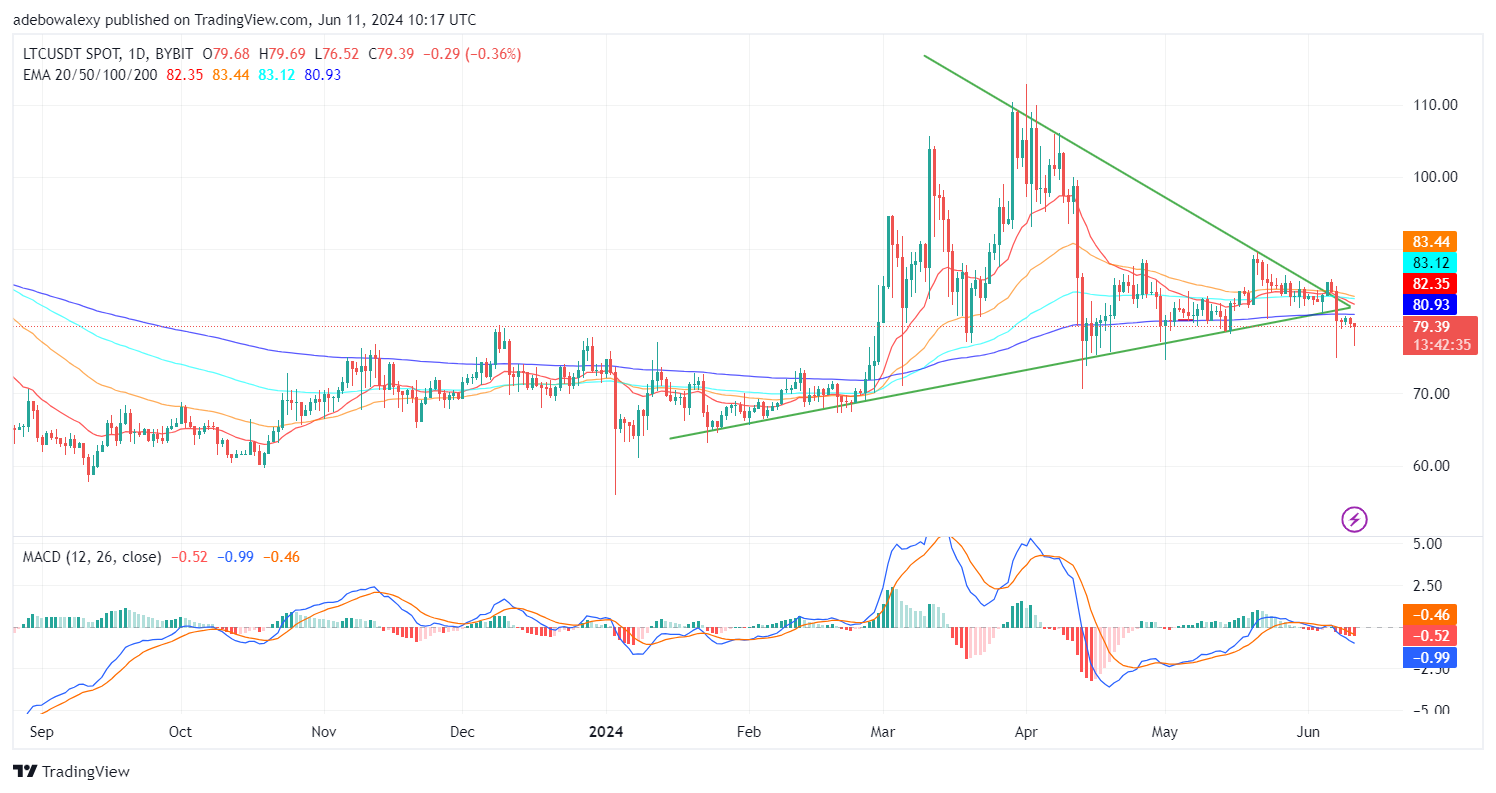
Price action in the Litecoin market faked a bullish breakout during the previous week. However, the fakeout resulted in a steeper downward correction through the floor of the drawn symmetrical triangle. Also, the price activity has fallen below all the Exponential Moving Average (EMA) lines. While price action lies below the EMA lines, it can be seen that price action is contracting significantly, considering the appearance of more recent price candles. The Moving Average Convergence Divergence (MACD) lines can be seen falling below the equilibrium level.
Litecoin Price Prediction: Headwinds Are Having a Hard Time in the LTC/USDT Market
Litecoin’s price movement remains bearishly biased on the daily market. Price candles can be seen below the EMA lines, which have a strong bearish implication for the market. The last price candle here appears as a hammer-shaped price candle.
The appearance of this price candle at the end of a downward correction has a bullish implication. This suggests that upside forces are already acting in the session. Be that as it may, we can see that the MACD indicator lines are proceeding below the equilibrium level. The bar of the indicator also appears solid red, implying that downward forces are still having a significant effect in the session.
LTC/USDT Medium-term Trend: Litecoin Bulls Are Making a Stand at the $78.00 Mark (4H Chart)
While it was noted above that price action in today’s session has been contracting upwards, the 4-hour market has revealed that an upward correction had started in the market. Since the previous session, the price candles have been seen rebounding off the $78.00 mark. Nevertheless, the coin continues to trade below the EMA lines. The last price candle on this chart shows that price action is now heading towards the $80.00 mark.
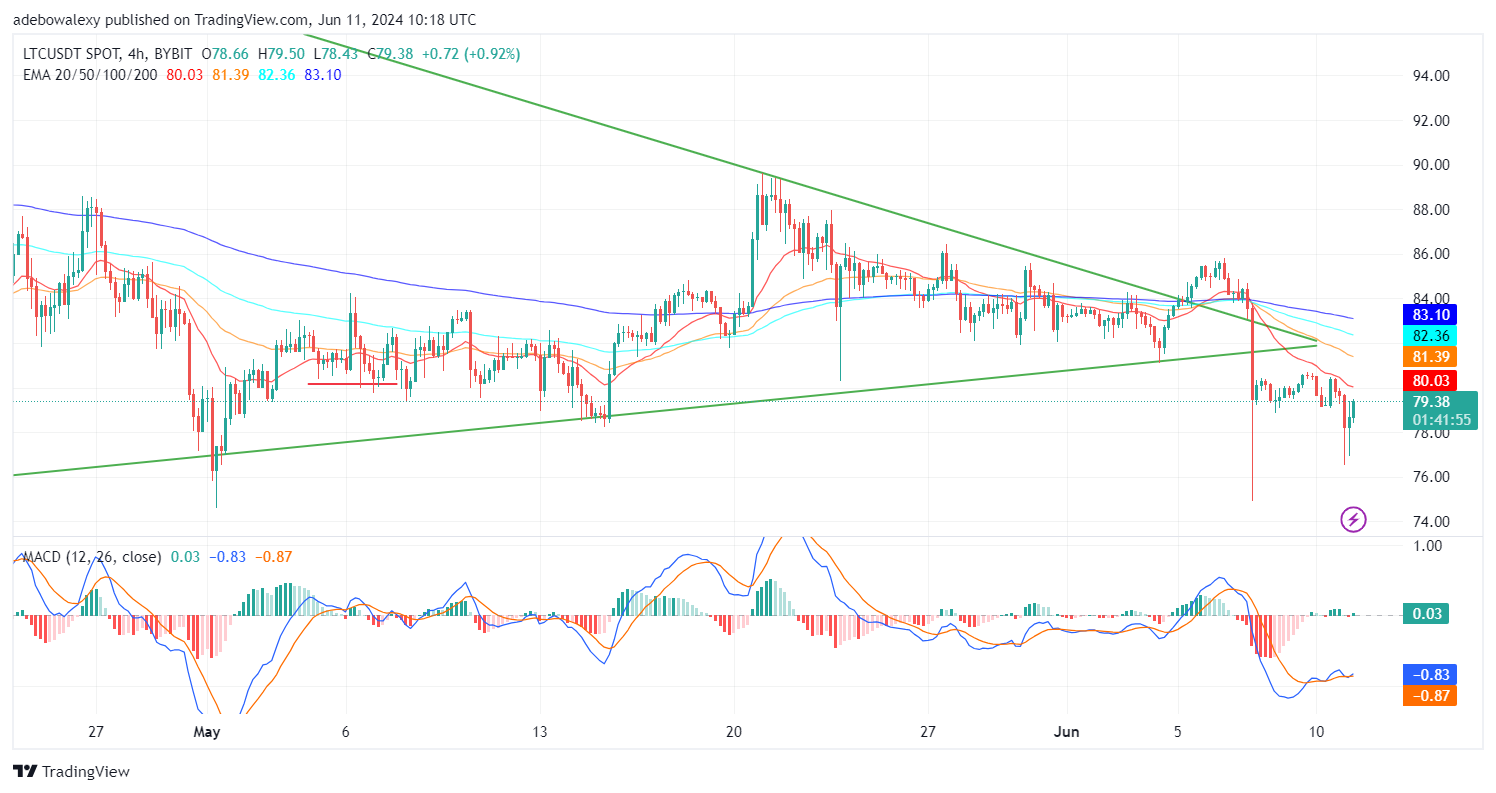
Additionally, the MACD curves seem to be at the initial stage of a bullish crossover. The ensuing lines can be seen gradually taking an upward trajectory. The upside correction is still in its infancy and, as such, seems quite vulnerable should headwinds grow stronger. However, should price action cross above the 20-day EMA line, the market may gain more traction through the $80.00 mark. However, a continued downward correction is more likely towards the $75.00 mark.