BNB (BNB/USDT) Eyes Recovery from Recent Dip
Estimated Reading Time: 3 minutes
Don’t invest unless you’re prepared to lose all the money you invest. This is a high-risk investment and you are unlikely to be protected if something goes wrong. Take 2 minutes to learn more
BNB Long-term Analysis: Ranging
The market for BNB, the Binance native coin, against the Tether (USDT) has been hovering within a close range. However, the price seems to be recovering as the pair eyes a potential breakout.
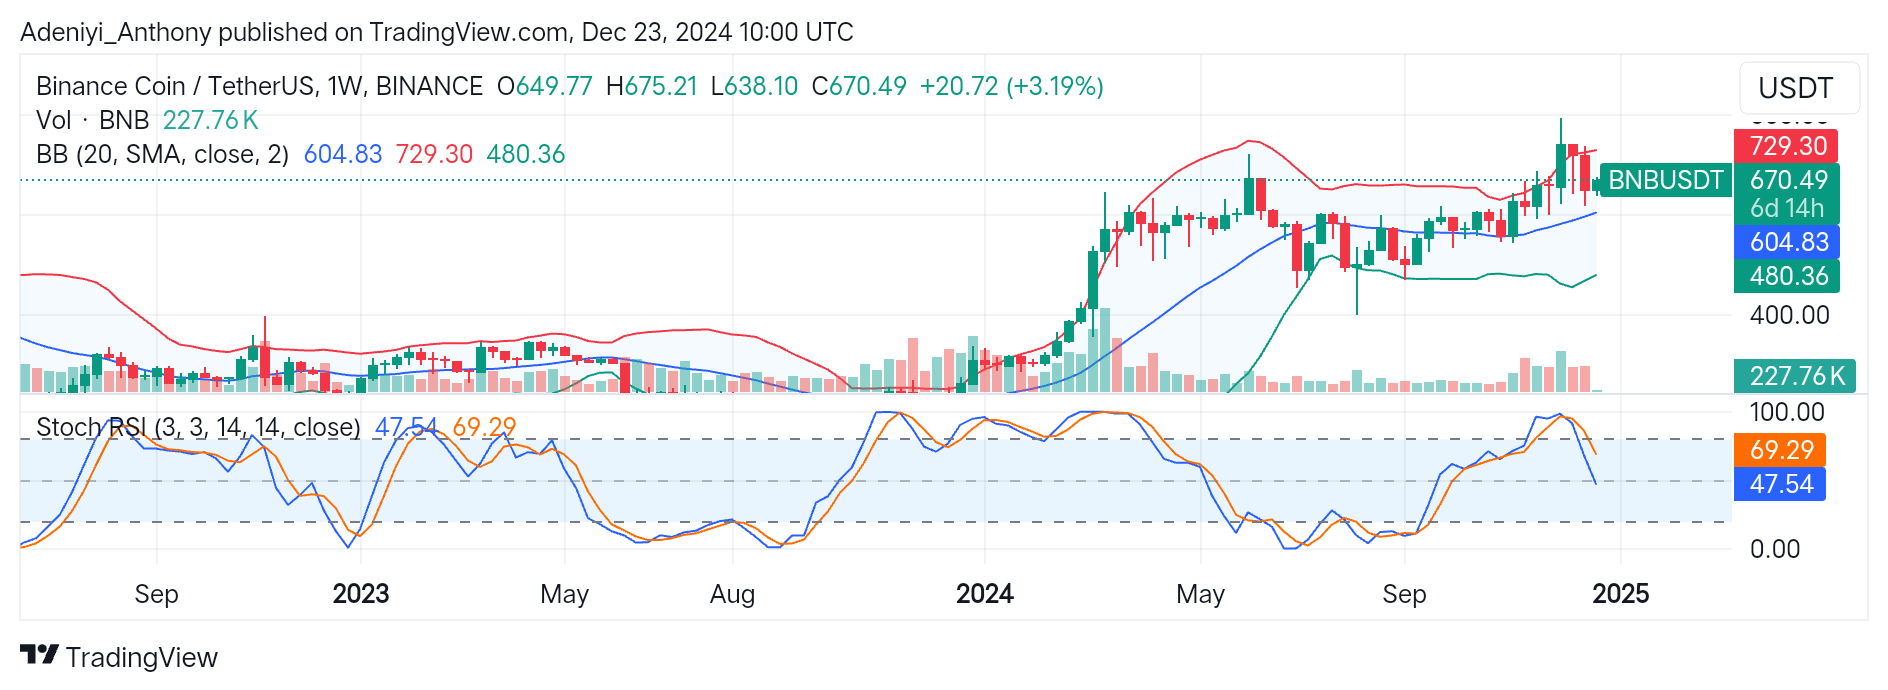
Recently, on a weekly timeframe, the pair appears to have been acting around the upper Bollinger band around $729.30 before correcting towards $600. However, BNB has shown signs of resilience by rebounding from this low, establishing a solid upward trend.
To this end, BNB/USDT approaches critical levels, hinting at a possible upside breakout as trading activities increase for the week.
Currently, BNB/USDT is trading at $670.49, with 227.76k traded volumes for the week.
Technical Indicators
Major Resistance Levels: $675, $730, and $800
Major Support Levels: $604, $550, and $480
BNB Technical Analysis
On a weekly timeframe, BNB has been trading near the upper Bollinger band, indicating the presence of bullish traders regardless of the recent price dip and a range-bound activity between $604 and $700. However, a breakout below $604 would lead to the continuation of the consolidation phase or the re-test of previous support levels. Conversely, with the formation of a bullish candlestick, a break above $700 could position the pair for $730.
Additionally, the Stochastic RSI suggests the pair operates in the neutral zone with the lines pointing downwards. On this note, for a bullish breakout, traders need to wait for a line crossover with some improvement towards the 60-mark level; otherwise, the pair may see another fall if the condition remains unchanged.
BNB/USDT Analysis: What are the Odds?
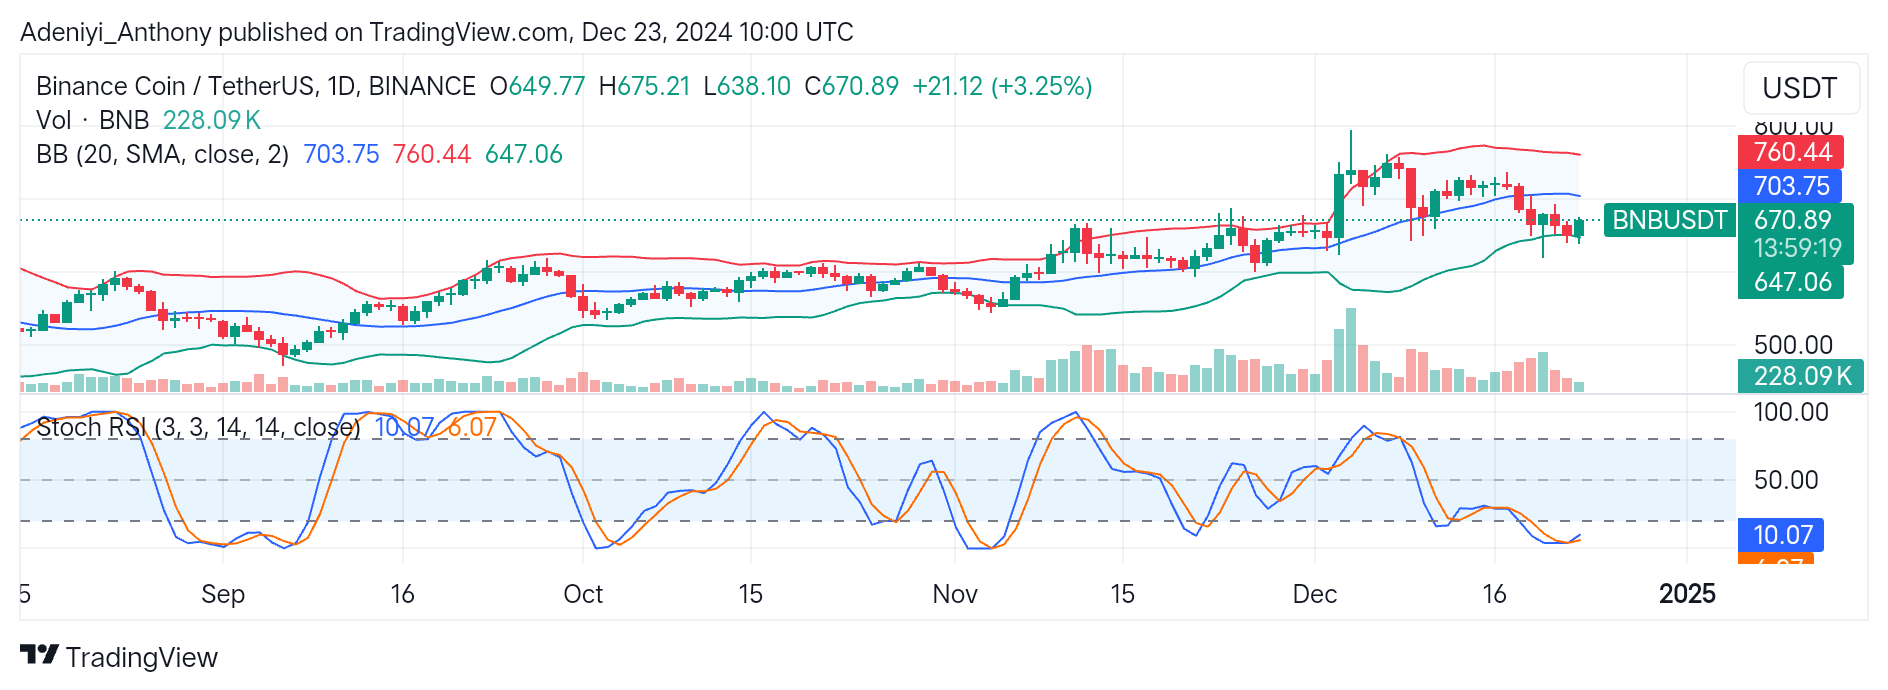
On the daily timeframe, BNB/USDT has seen a moderate rebound at $647.06 after facing mild selling pressure. This represents a 3.25% increase from the previous low, and an attempt to regain bullish momentum amid market uncertainty.
However, a recent increase of 21.12 above $647.06 may not be enough to ascertain a sustained uptrend. Therefore, a breakout above the $700 psychological level and a spike in volume would signal a bullish trend.
Additionally, the Stochastic oscillator at the bottom of the chart indicates a potential upside movement. However, a cross above the oversold region would confirm a bullish move in the short term. Therefore, a rejection at the current level may lead to the re-test of $649 or lower support levels.
You can purchase crypto coins here. Buy LBlock