Tamadoge (TAMA/USD) Defends Key Support, Primed for Breakout
Estimated Reading Time: 3 minutes
Don’t invest unless you’re prepared to lose all the money you invest. This is a high-risk investment and you are unlikely to be protected if something goes wrong. Take 2 minutes to learn more
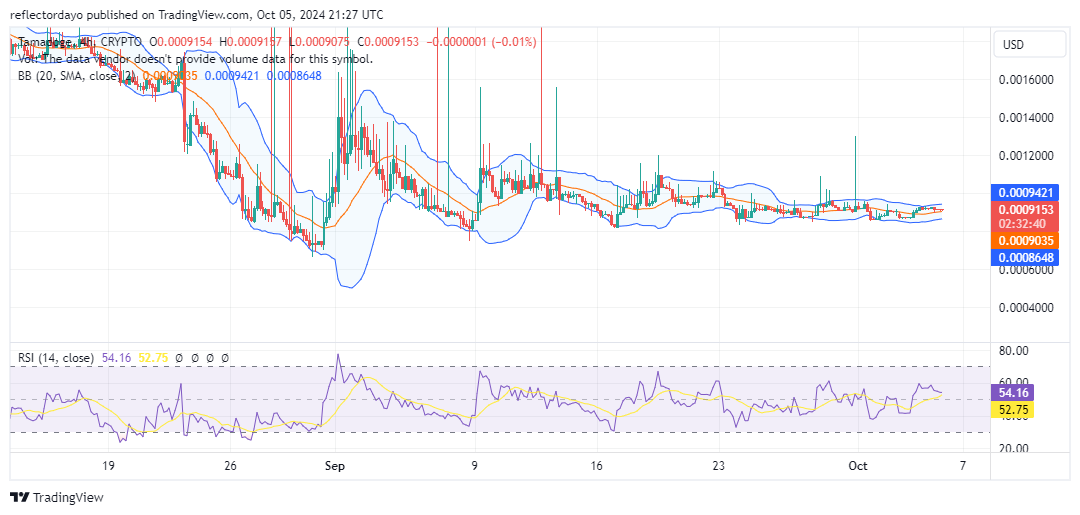
Tamadoge has been consolidating within a horizontal price range, maintaining steady movement around the $0.0091 level. The key support at $0.00085 has remained robust, effectively preventing further declines. However, the market has struggled to build sustained upward momentum. Despite several failed attempts to break above resistance, there is growing optimism that Tamadoge may soon overcome the long-standing resistance near $0.001.
Key Levels
- Resistance: $0.013, $0.014, and $0.015
- Support: $0.0008, $0.00078 and $0.00074
TAMA/USD Price Analysis: The Indicators’ Point of View
The market remains at a crossroads, with bulls successfully defending the $0.00085 support level. However, they have not yet gathered sufficient momentum to push prices significantly higher, particularly beyond the $0.01 mark, which would be needed to establish a sustained bullish trend.
When a market consolidates at a specific price level for an extended period and the Bollinger Bands converge around that range, it indicates a phase of low volatility. This contraction of the Bollinger Bands suggests that the price is trading within a narrow range. Often referred to as the “calm before the storm,” this phase signals that the market could be preparing for a significant breakout in either direction.
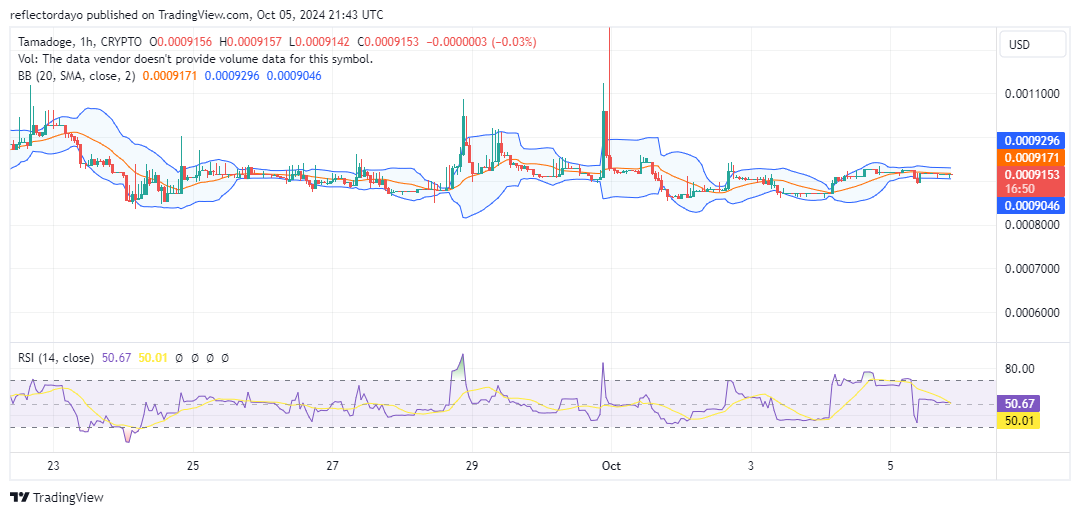
Tamadoge Short-Term Outlook: 1-Hour Chart
The 1-hour chart presents a similar crypto signal as seen in the 4-hour chart. In the 1-hour view, the Tamadoge market appears flat, moving in line with the horizontally-trending 20-day moving average, suggesting a standstill around the $0.0091 level. Despite this stagnant appearance, the convergence of the Bollinger Bands typically indicates an upcoming move, as it reflects a period of very low volatility and limited trading activity.
A significant market move is likely imminent, as prolonged consolidation rarely persists. The fact that bulls have consistently defended the $0.0085 support level and resisted bearish pressure below $0.01 suggests that, once volatility returns, the market could likely break to the upside.
Buy TAMA/USD!
Fill your weekend by playing five exhilarating play-to-earn arcade games! 🕹️💰
Battle your way to the top of the weekly leaderboards and load up on $TAMA rewards!
Download on mobile now 👇
📱 Android: https://t.co/D4TjX7gTFl
📱 iOS: https://t.co/0fjJapf5oA pic.twitter.com/6MCruiKcet— TAMADOGE (@Tamadogecoin) September 13, 2024