$SPONGE (SPONGE/USD) Consolidates Along $0.00046, Exploring Potential Rally
Estimated Reading Time: 3 minutes
Don’t invest unless you’re prepared to lose all the money you invest. This is a high-risk investment and you are unlikely to be protected if something goes wrong. Take 2 minutes to learn more
Given the persistently low volatility in the $SPONGE market, the bulls have been unable to capitalize fully on the momentum gained from the $0.00044 price level. While the third 4-hour period witnessed a bullish candlestick, indicating an upward price thrust, the subsequent decline saw the price retracing to approximately $0.000457, revealing the challenges faced by bulls in sustaining a bullish trend.
Critical Price Levels:
- Resistance: $0.00047, $0.00050, and $0.00060.
- Support: $0.000350, $0.00030, and $0.00025.
Technical Insights for $SPONGE (SPONGE/USD) Price Analysis:
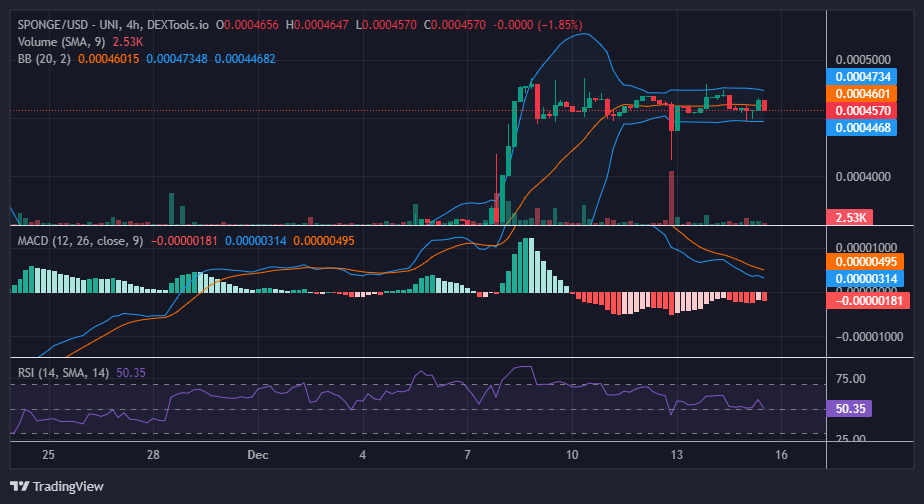
Examining the current $SPONGE market through the lens of Bollinger Bands and the Relative Strength Index reveals a market characterized by lateral movements. Despite the lack of significant changes since yesterday’s analysis, the observed price fluctuations continue to navigate within a range-bound channel, with the present price maintaining stability around $0.0004643. This particular level stands as critical support, potentially influencing an impending bullish upswing.
In the context of the Moving Average Convergence and Divergence (MACD) indicator, a noteworthy shift is taking place. The two MACD lines, previously positioned above the zero level, are now on a descent, albeit with short histograms. This evolving dynamic raises the possibility of convergence between the lines and the histograms at the zero level, signaling a consolidation trend that warrants close attention in the unfolding market scenario.
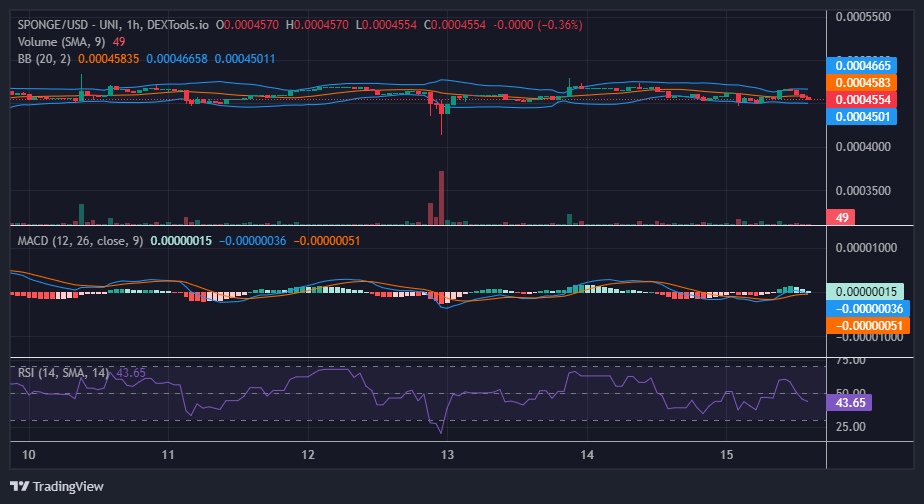
Short-Term Outlook on the 1-Hour Chart:
Upon analyzing the 4-hour chart, it is evident that the market remains in a sideways range. Indicators such as the Bollinger Bands, the Moving Average Convergence and Divergence (MACD), and the Relative Strength Index (RSI) consistently depict a stagnant market condition. The diminishing bandwidth of price swings reflects the tightening competition between demand and supply forces. Given these dynamics, there is potential for a notable bullish price movement in the near future.
Buy SPONGE/USD!
There can only be one king 🧽🧽💦$SPONGE #Crypto #MemeCoin pic.twitter.com/DK2b7zeQCo
— $SPONGE (@spongeoneth) December 15, 2023
Invest in the hottest and best meme coin. Buy Sponge ($SPONGE) today!