Quant (QNT) Price Under Pressure: Bulls Fight Back in Short-Term Spikes
Estimated Reading Time: 3 minutes
Don’t invest unless you’re prepared to lose all the money you invest. This is a high-risk investment and you are unlikely to be protected if something goes wrong. Take 2 minutes to learn more

Quant (QNT) Technical Analysis – August 3
Quant (QNT) has recently shown a complex pattern of short-term volatility, against a backdrop of longer-term decline. Quant is currently priced at $66.20, reflecting a slight drop of 1.89% in the past 24 hours. Despite this dip, trading activity remains robust, with a 24-hour trading volume of $29,501,232 and 441,396 QNT coins traded.
Daily Chart Analysis
On the daily chart, QNT exhibits a bearish trend. The Bollinger Bands have narrowed significantly, signaling potential volatility ahead, with the price consistently trading below the middle SMA—indicative of persistent bearish sentiment.
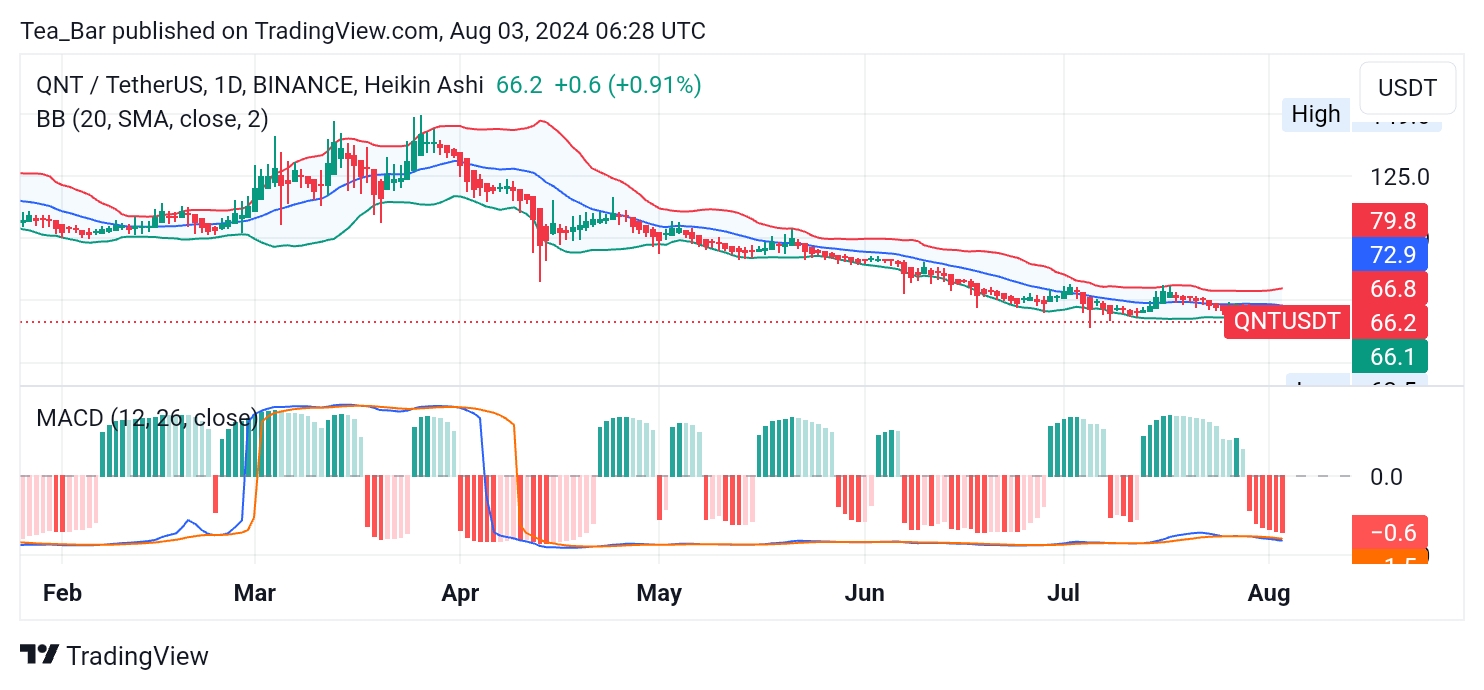
Additionally, the MACD remains below the signal line, further supporting the downtrend. Despite this, the slight positive change in the day’s trading, with a rise of 0.91% from the last drop, suggests some resistance to the downward pressure.
4-Hour Chart Analysis
The 4-hour chart provides a more nuanced view of the intraday movements. The Bollinger Bands here are wider, suggesting more immediate volatility. The recent price movement has been towards the lower band, with a temporary dip to $64.99 before a recovery.
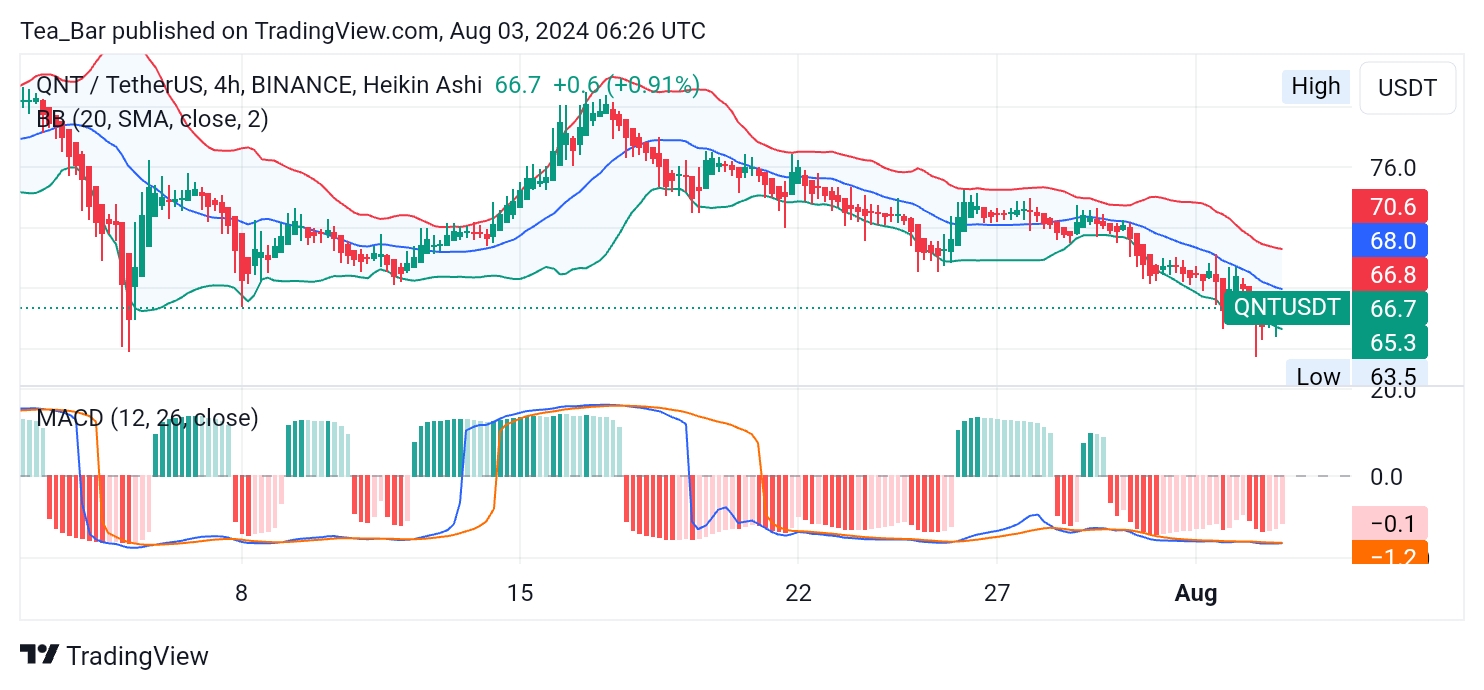
This kind of movement, coupled with a MACD that shows short-lived bullish crossovers, indicates sporadic attempts at a recovery, though the general momentum remains bearish.
Conclusion
Quant’s market behavior is a tale of resilience amid challenges. The price has declined significantly over the last month (17.33%) and week (10.21%), yet it has managed small rebounds from its lowest points (up 3.49% and 1.60%).
This resilience in the face of a bearish trend suggests that while the overall market sentiment remains negative, there is potential for recovery if supported by favorable broader market conditions.
Market participants should watch for potential volatility suggested by the Bollinger Bands and look for stronger bullish signals on the MACD before considering entry points, keeping an eye on macroeconomic factors that might affect market sentiment.
In order to place winning trades with us via Bybit, You can open an account here.