Wall Street Memes (WSM) Prices Retreat Fast, Buyers Stay Steady
Estimated Reading Time: 3 minutes
Don’t invest unless you’re prepared to lose all the money you invest. This is a high-risk investment and you are unlikely to be protected if something goes wrong. Take 2 minutes to learn more

Wall Street Memes Price Prediction – September 15
A basement re-validation process has been ongoing, wherein the Wall Street Memes coin is consistently bench-marked against the market value of the US dollar (American fiat currency), and this unfolding financial situation reflects a rapid decline in prices, thereby prompting buyers to maintain a steady posture amid the downturn.
Despite the rapid decline in prices, the Wall Street Memes coin’s steady bench-marking against the US dollar shows resilience, as buyers remain calm and consistent. This patience reflects confidence in the market’s ability to stabilize, suggesting that disciplined holders may benefit from stronger positioning once recovery momentum begins to build in the broader financial landscape.
WSM/USD Market
Key Levels
Resistance levels: $0.0006, $0.0007, $0.0008
Support levels: $0.0004, $0.0003, $0.0002
WSM/USD – 4-hour Chart
The WSM/USD medium-term chart showcases that crypto-economic prices retreat fast, resulting in buyers staying steady.
The Bollinger Band trend lines are practically positioned in a flagship pattern, bordering around decent longing entries with improving momentum strength that reinforces potential breakout opportunities. The Stochastic Oscillators have dipped into the oversold region, clearly signaling that buying moves are on the verge of recouping strongly with renewed confidence and directional sustainability.
Will Rapid WSM/USD Price Declines Sustain Buyer Steadiness, Signaling Potential Resilience in the Market?
The WSM/USD market selling options now undermines long-term growth; instead, apply accumulation strategies, dollar-cost averaging, and disciplined staking to strengthen positioning while awaiting confirmed bullish reversals.
Long-term position holders are better served by maintaining systemic strategies such as steady re-entries at discounted levels, portfolio re-balancing toward undervalued assets, and compounding through staking rewards. Such approaches build resilience, ensuring capital preservation while maximizing eventual upside as markets recover, granting long-term investors an edge through accumulation, liquidity management, and confidence to withstand cyclical volatility.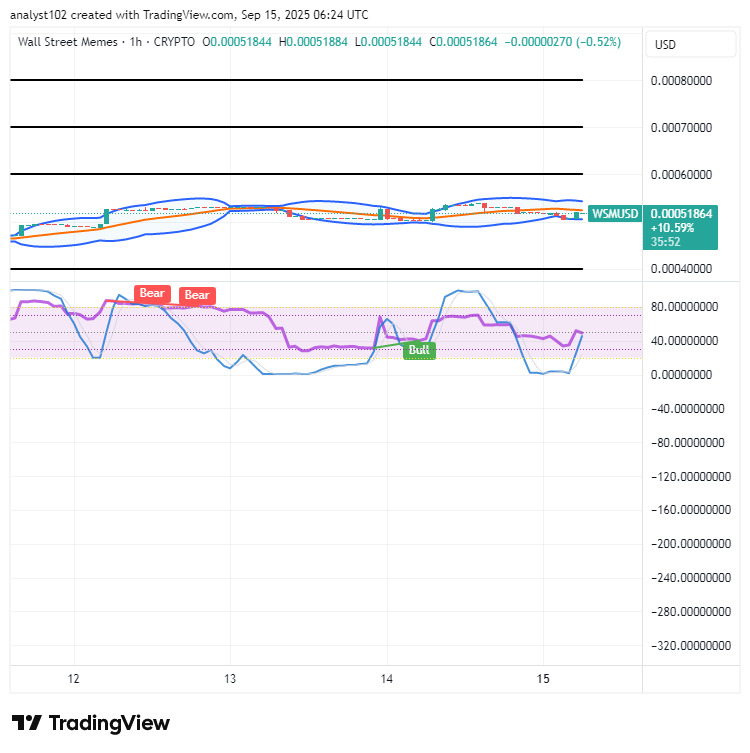
WSM/USD 1-hour chart
The 1-hour chart of the WSM/USD market shows that the crypto-economic markets retreat fast, as buyers stay steady.
The Bollinger Bands have stretched sideways with a decisive tilt upward, confirming that purchasers are aggressively positioning for gains. Simultaneously, the Stochastic Oscillators are surging northbound, powering out of the oversold region and signaling strong momentum for sustained bullish advances.
In the past 24 hours, the $WSM token and community has endured a severe coordinated attack, as malicious hackers deliberately targeted our vibrant Discord community platform.
Over the last 24 hours, The $WSM token and community has undergone a coordinated attack. The hackers specifically targeted our Discord community.
— Wall Street Memes (@wallstmemes) October 12, 2023
We reiterate that no one from the Wall St Memes team will ever direct message you first, or ask for any personal information – even… pic.twitter.com/VwySpXC7cz