Quant (QNT): Recovery on the Horizon After Short-Term Downturn?
Estimated Reading Time: 3 minutes
Don’t invest unless you’re prepared to lose all the money you invest. This is a high-risk investment and you are unlikely to be protected if something goes wrong. Take 2 minutes to learn more

Quant (QNT) Technical Analysis – July 24
Quant (QNT), at press time, is currently priced at $74.45, showing a minor decline of 0.01% over the last 24 hours. In this period, 293,568 QNT coins were traded, resulting in a trading volume of $21,782,036.
Opening today at $73.49, QNT has risen by 0.97% from its opening price. This analysis explores Quant’s performance using daily and 4-hour chart data.
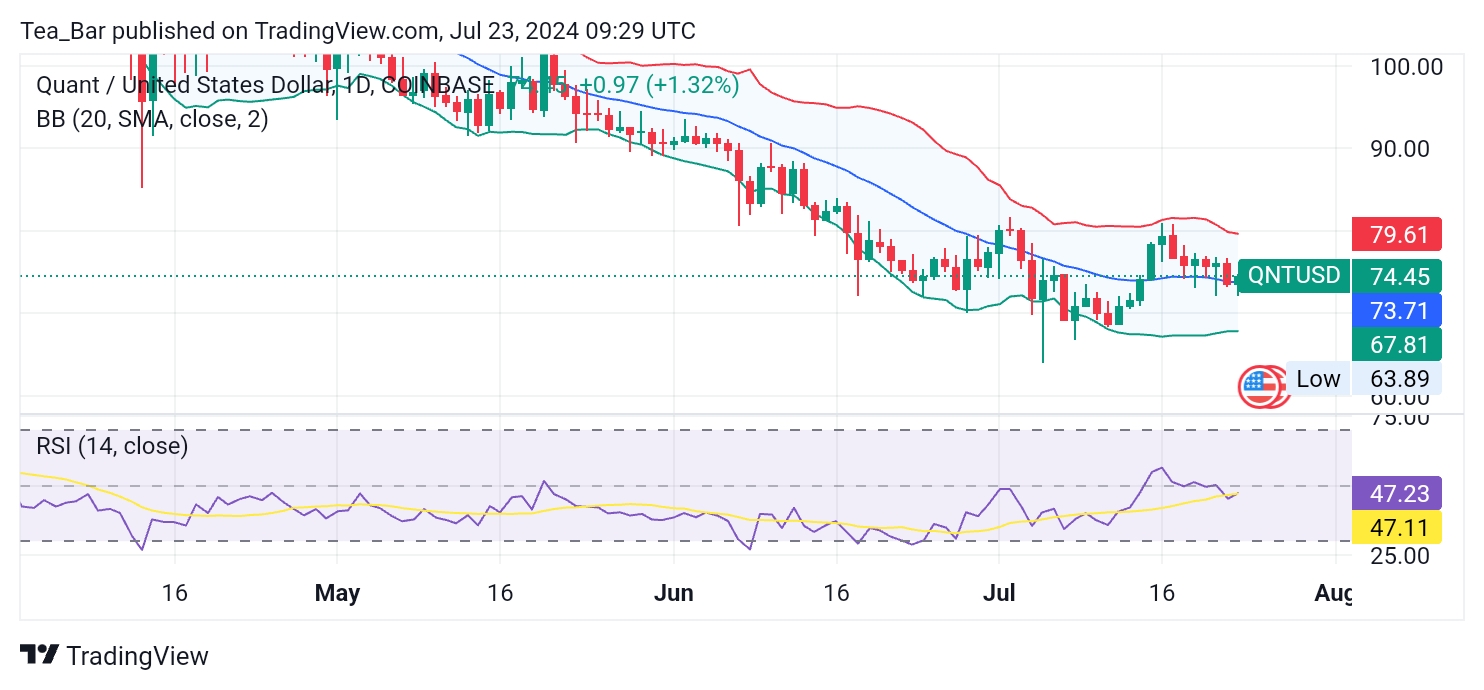
Quant (QNT) Daily Chart Analysis
On the daily chart, Quant (QNT) started the day at $73.49 and has managed to climb 0.97% from this opening, despite an initial drop to $72.27. Over the last 30 days, QNT’s value has decreased by 8.90%, and over the past week, it has dropped by 8.22%.
However, from the lowest price recorded in these periods, QNT has seen a strong recovery of 14.92% over the month and 2.21% over the week.The Bollinger Bands on the daily chart show an upper band at $79.61, a middle band at $73.71, and a lower band at $67.81.
The RSI (Relative Strength Index) for the past 14 days is at 47, which indicates a neutral market sentiment. This suggests that there is potential for upward movement if positive momentum continues.
Quant (QNT)4-hour Chart Analysis
The 4-hour chart provides a more detailed look at Quant’s short-term performance. The Bollinger Bands indicate an upper band at $76.75, a middle band at $74.80, and a lower band at $72.85, pointing to a relatively stable range with room for upward movement.
The RSI on the 4-hour chart is at 44, indicating a neutral sentiment leaning slightly towards the oversold zone, which may suggest a buying opportunity if the price begins to rise.
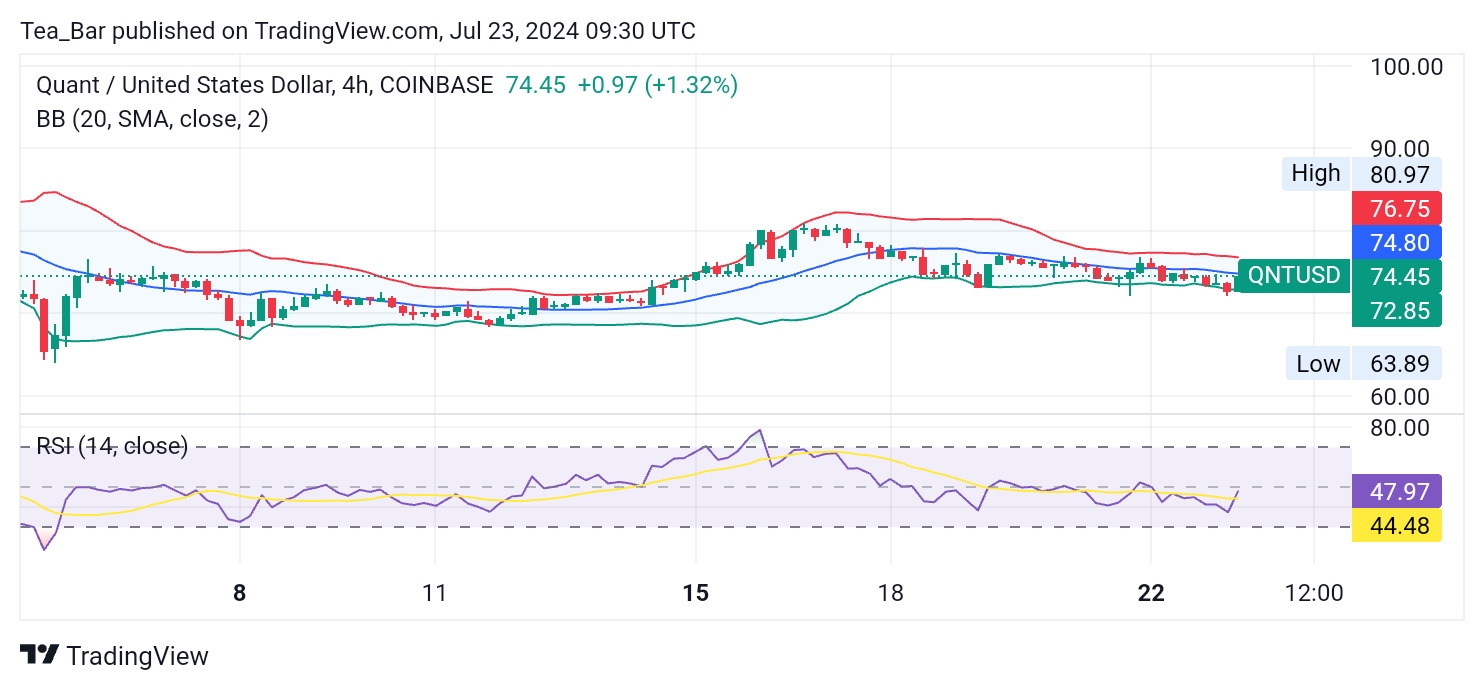
The 4-hour chart also highlights the resistance QNT faces at higher levels but shows efforts to regain its upward trajectory. Breaking through the upper Bollinger Band could indicate a stronger bullish trend.
Conclusion
Quant (QNT) shows promising signs of recovery and resilience, with a minor increase from its opening price today and substantial trading volume. Despite recent declines over the past month and week, the coin is showing signs of rebounding, as evidenced by significant increases from recent lows.
Key resistance levels to monitor include the psychological barrier at $75 and the upper Bollinger Band at $79.61. The technical indicators from both the daily and 4-hour charts suggest that QNT has the potential for continued growth.
In order to place winning trades with us via Bybit, You can open an account here.