Quant (QNT) Rebounds Despite Dip, Technicals Hint at Potential Growth
Estimated Reading Time: 3 minutes
Don’t invest unless you’re prepared to lose all the money you invest. This is a high-risk investment and you are unlikely to be protected if something goes wrong. Take 2 minutes to learn more

Quant (QNT) Technical Analysis – July 11
Quant (QNT) is demonstrating resilience with its price currently at $70.44, despite a slight decrease of 1.15% over the past 24 hours. During this period, 124,070 QNT coins were traded, leading to a trading volume of $8,739,841.
With a circulating supply of 12 million coins, Quant’s market capitalization stands strong at $850 million. This technical analysis examines Quant’s performance through its daily and 4-hour charts.
Daily Chart Analysis
On the daily chart, Quant (QNT) opened at $70.05 and is up by 0.56% from the opening price. Although it dipped to an intraday low of $69.16, QNT has shown an upward movement from this point. Over the past 30 days, QNT has decreased by 22.10% from its maximum value, and by 12.36% over the past week.
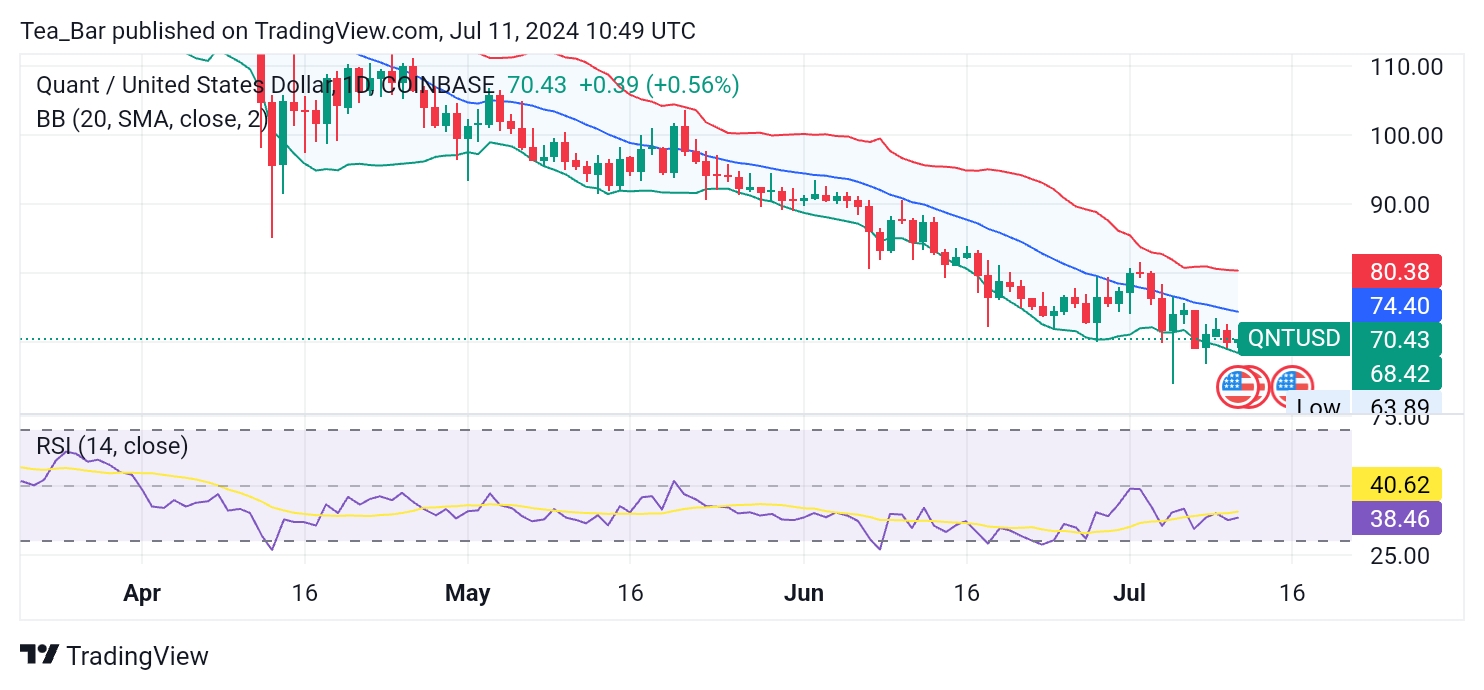
Source: TradingView
However, from its minimum price during these periods, QNT has risen by 9.10%, indicating a recovery effort.The Bollinger Bands on the daily chart show an upper band at $72.88, a middle band at $70.89, and a lower band at $68.91.
The RSI (Relative Strength Index) for the past 14 days is at 45.65, which places QNT in the neutral zone, indicating balanced buying and selling pressures. This suggests potential for upward movement if market sentiment turns more positive.
4-hour Chart Analysis
The 4-hour chart provides a closer look at Quant’s short-term trends. The Bollinger Bands indicate an upper band at $80.38, a middle band at $74.40, and a lower band at $68.42, showing a broader range and potential for volatility.
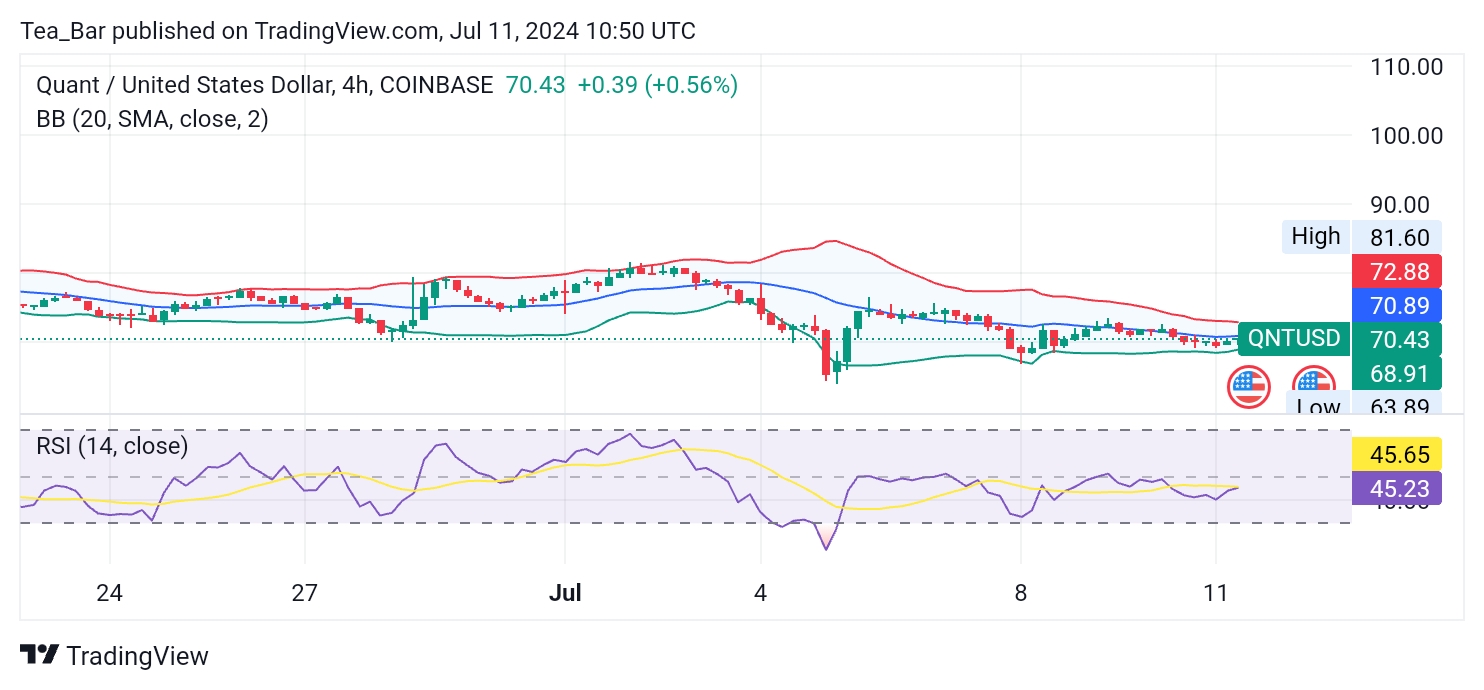
The RSI on the 4-hour chart is at 40.62, suggesting a slightly bearish sentiment but still within a range where a positive shift could occur.The 4-hour chart highlights the resistance faced at higher levels but also suggests that QNT is attempting to climb back. If QNT can sustain momentum and break through the upper Bollinger Band, it may lead to stronger bullish activity.
Conclusion
Quant (QNT) is showing promising signs of recovery and resilience with a slight rise from its opening price today. Despite recent declines over the past month and week, the coin is making efforts to rebound, as evidenced by its 9.10% increase from recent lows. The technical indicators from both the daily and 4-hour charts suggest that QNT has the potential for further upward movement.
In order to place winning trades with us via Bybit, You can open an account here.