Quant (QNT) Gains Momentum with Potential for Further Growth
Estimated Reading Time: 3 minutes
Don’t invest unless you’re prepared to lose all the money you invest. This is a high-risk investment and you are unlikely to be protected if something goes wrong. Take 2 minutes to learn more

Quant (QNT) Technical Analysis – July 9
Quant (QNT) is experiencing a positive surge, with its price currently standing at $71.4, reflecting a 2.83% increase in the last 24 hours. The trading volume over this period was impressive, with 133,258 QNT coins exchanged, amounting to $9,523,958.
This analysis delves into the daily and 4-hour chart trends to provide a comprehensive technical overview of Quant’s performance.
Daily Chart Analysis
On the daily chart, Quant (QNT) opened at $70.91 and is now up by 0.78% from the opening price. Despite reaching an intraday high of $73.08, QNT faced resistance and couldn’t sustain its upward momentum.
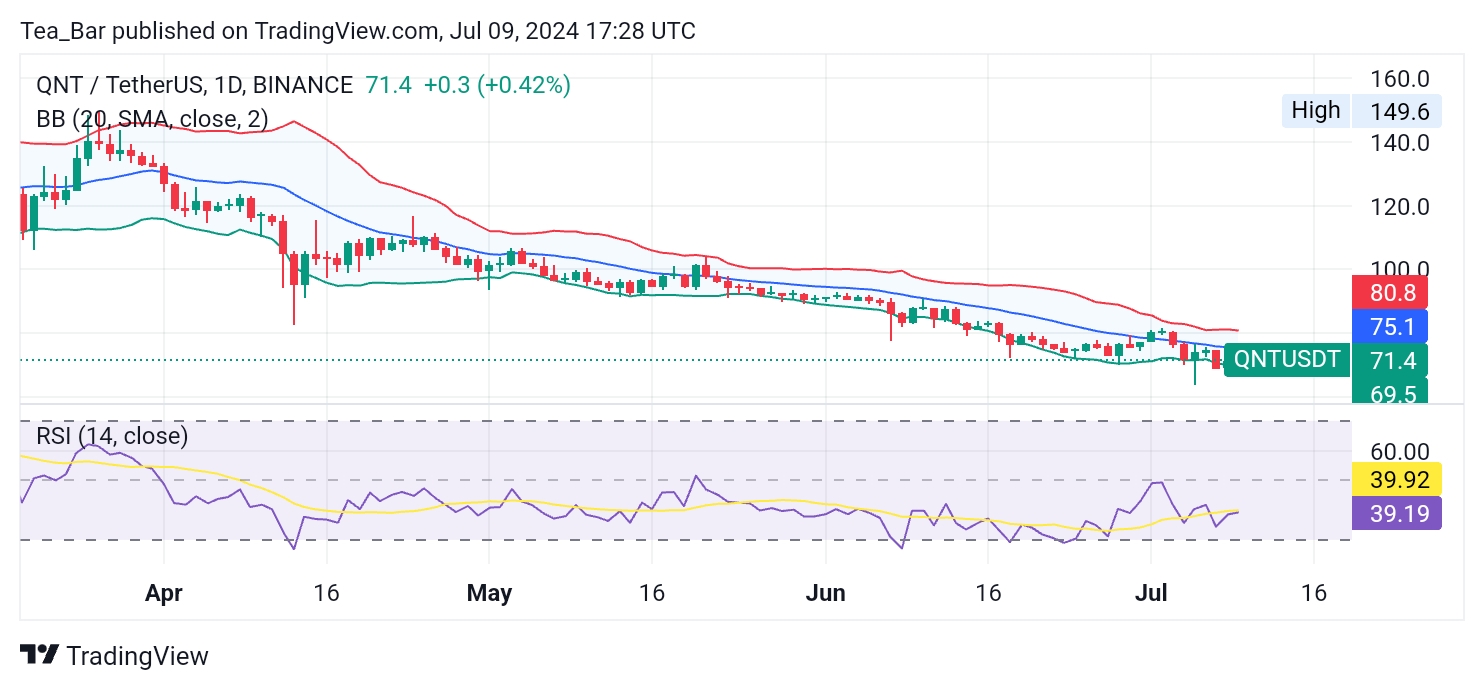
Source: TradingView
Over the past 30 days, QNT has decreased by 20.97% from its maximum value, while it’s down by 12.25% from its peak in the last 7 days.
However, from its minimum price over the same periods, QNT is up by 10.70%, showcasing resilience.The Bollinger Bands on the daily chart indicate an upper band at $80.8, a middle band at $75.1, and a lower band at $69.5, suggesting potential volatility.
The RSI (Relative Strength Index) for the past 14 days is at 39.92, indicating that QNT is currently in the neutral zone, leaning towards being oversold. This implies that there might be room for a bullish reversal if buying pressure increases.
4-hour Chart Analysis
On the 4-hour chart, the Bollinger Bands show an upper band at $75.6, a middle band at $71.9, and a lower band at $68.3. This tighter range suggests less volatility in the short term compared to the daily chart.
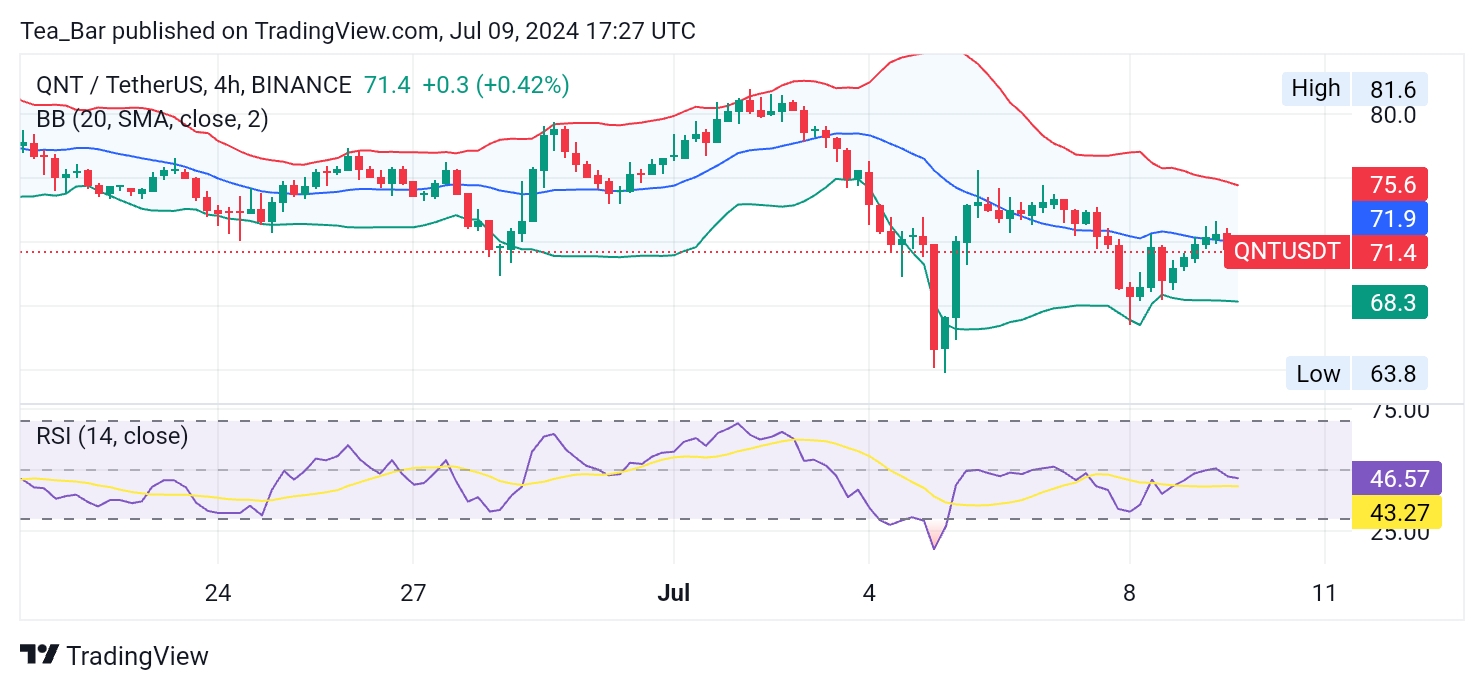
Source: TradingView
The RSI on the 4-hour chart stands at 43.27, which is closer to the neutral mark, indicating a balanced sentiment among traders.The 4-hour chart further highlights the resistance faced at the $73.08 level.
However, the RSI and Bollinger Bands suggest that Quant (QNT) has the potential to test this resistance again. If QNT can break through this level, it may trigger a stronger upward movement.
Conclusion
Quant (QNT) demonstrates a positive trajectory with a 2.83% rise over the last 24 hours, supported by significant trading volume. While the daily and 4-hour charts indicate some resistance, the overall technical indicators suggest a potential for continued growth.
Investors should watch for a break above the $73.08 resistance level, which could signal a more substantial bullish trend.
In order to place winning trades with us via Bybit, You can open an account here.