Polkadot (DOT/USDT) at Crossroads as Bullish Momentum Brews
Estimated Reading Time: 3 minutes
Don’t invest unless you’re prepared to lose all the money you invest. This is a high-risk investment and you are unlikely to be protected if something goes wrong. Take 2 minutes to learn more
Polkadot Long-term Analysis: Ranging
On the general crypto market level, Bitcoin and some altcoins have been given yet another cautiously optimistic view. Polkadot against the Tether is showing early signs of a potential trend reversal following a prolonged bearish cycle. However, the pair, which has experienced a dip towards the $4.800 level, is now trading with minor losses, trading above the dynamic line of the Bollinger Bands.
Recently, price movement indicates the pair is attempting to reclaim a bullish stance, with the Stochastic RSI suggesting more improvement can be made. However, the volume keeps depleting, suggesting a possible short-term pullback as the Bollinger Bands squeeze, signaling a potential bounce afterwards.
Currently, Polkadot trades at $5.072, recording 2.37% losses in traded volume after opening at $5.097 for the week.
Technical Indicators
Major Resistance Levels: $6.000, $6.998, and $8.000
Major Support Levels: $4.900, $4.200, and $2.800
Polkadot Technical Analysis
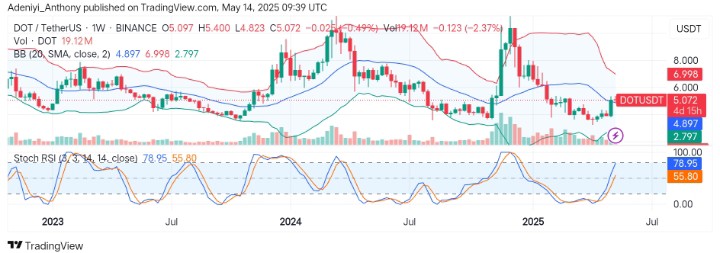
At the moment on the weekly chart, Polkadot against the Tether appears to be hovering above $4.897, the mid-band, indicating the pair is at a potential pivot point. However, the Stochastic oscillator points to a growing bullish strength as the lines point to the north despite the drop in the traded volume.
To this end, $6.998 and $2.797 are the current extreme points; extended bullish momentum would lead to an improvement towards the former, while movement towards the latter may be caused by the bull’s failure to defend the price above the dynamic level.
DOT/USDT Analysis: Expectations
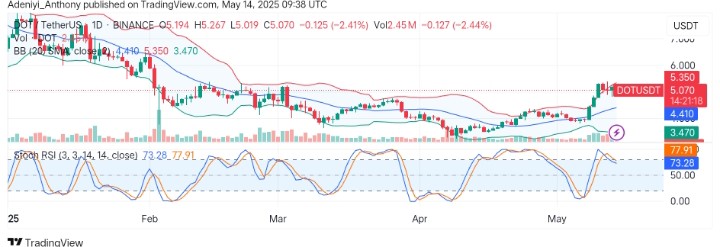
On the daily timeframe, DOT/USDT appears to be struggling around the upper line of the Bollinger Bands with over 2% loss in value, suggesting that the recent surge in volume has met a proportional bearish strength as the oscillator faces south.
The price action has shown a breakout followed by a consolidation with support at $4.410 if a retest occurs. However, a breakout above $5.350 could trigger a push towards $6.000 as the pair’s price holds under the current level.
You can purchase crypto coins here. Buy LBlock