Chainlink (LINK) Consolidates above $18, May Resume an Uptrend
Estimated Reading Time: 2 minutes
Don’t invest unless you’re prepared to lose all the money you invest. This is a high-risk investment and you are unlikely to be protected if something goes wrong. Take 2 minutes to learn more
Chainlink (LINK) Long-Term Analysis: Bearish
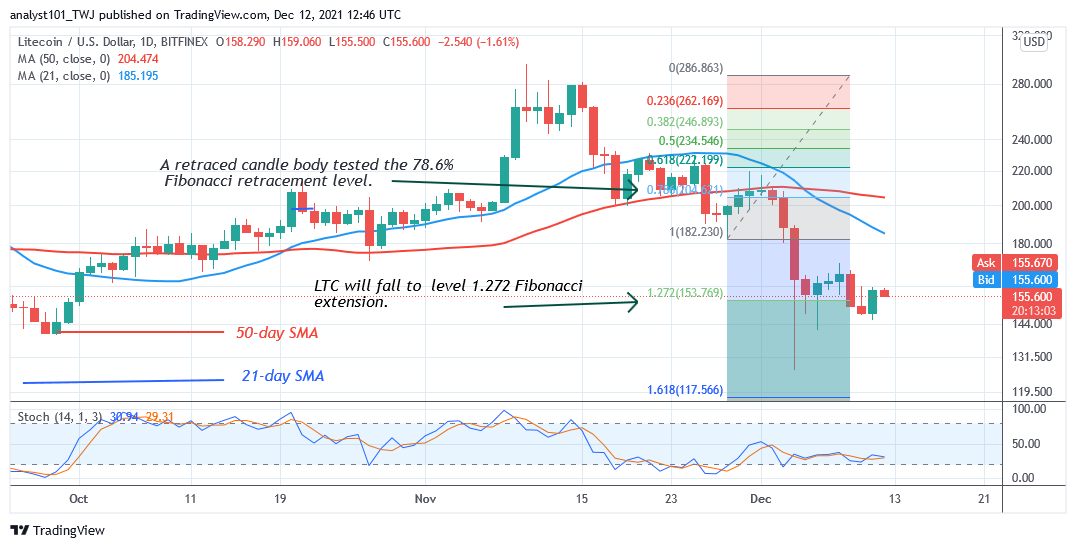
Chainlink’s (LINK) price consolidates above the $18 support. After the December 4 price breakdown, the bulls bought the dips as price corrected upward to the high of $23. The upward correction was interrupted as the altcoin declines. For the past week, the altcoin has been trading between $18 and $23 price levels. Meanwhile, on November 28 downtrend; a retraced candle body tested the 78.6% Fibonacci retracement level. The retracement indicates that LINK will fall to level 1.272 Fibonacci extension or $19.00 high. From the price action, the altcoin is fluctuating above the $19 support.
Chainlink (LINK) Indicator Analysis
The cryptocurrency is at level 36 of the Relative Strength Index for period 14. It indicates that the altcoin is still in the downtrend zone and capable of falling on the downside. The price bars are below the moving averages indicating the downtrend. LINK is above the 50% range of the daily stochastic. The altcoin is in a bullish momentum but the momentum is unstable.
Technical indicators:
Major Resistance Levels – $40.00, $42.00, $44.00
Major Support Levels – $26.00, $24.00, $22.00
What Is the Next Direction for Chainlink (LINK)?
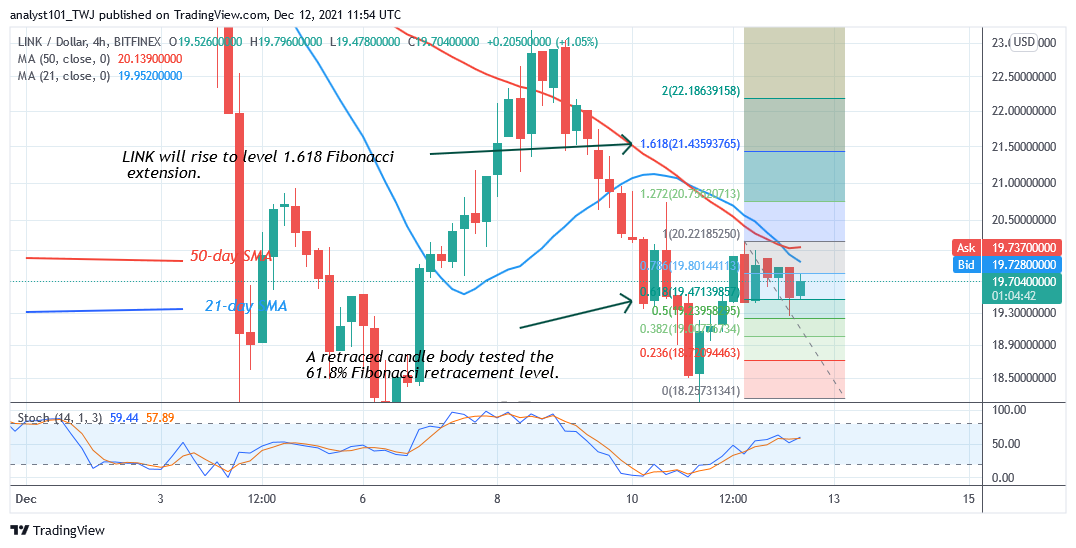
On the 4-hour chart, LINK is in an upward move. Since December 11, the altcoin has been fluctuating below the $23 resistance. Meanwhile, on December 11 uptrend; a retraced candle body tested the 61.8% Fibonacci retracement level. The retracement indicates that LINK will rise to level 1.618 Fibonacci extensions or $21.43.
You can purchase crypto coins here. Buy Token
Note: Cryptosignals.org is not a financial advisor. Do your research before investing your funds in any financial asset or presented product or event. We are not responsible for your investing results