Hedera Hashgraph (HBAR/USD) Drags Bears Along as They Set New Coordinates to $0.07
Estimated Reading Time: 3 minutes
Don’t invest unless you’re prepared to lose all the money you invest. This is a high-risk investment and you are unlikely to be protected if something goes wrong. Take 2 minutes to learn more
The Hedera Hashgraph market started its gradual upward journey in mid-June after establishing a pivot point at the $0.043 price level. However, the bull run encountered significant resistance from the bear market, causing the bullish price progress to slow down. In August, the market began to gather upward momentum, accompanied by an increase in trading volume.
By mid-August, the Hedera Hashgraph bull market had encountered substantial liquidity, subsequently leading to an elevated level of volatility. The bulls capitalized on this situation to effectively establish a support level above the $0.060 price level.
Hedera Hashgraph Market Data
- HBAR/USD Price Now: $0.064
- HBAR/USD Market Cap: $2.06 Billion
- HBAR/USD Circulating Supply: 32.9 Billion
- HBAR/USD Total Supply: 50 Billion HBAR
- HBAR/USD CoinMarketCap Ranking: #30
Key Levels
- Resistance: $0.065, $0.070, and $0.075.
- Support: $0.055, $0.050, and $0.045.
Price Prediction for Hedera Hashgraph: The Indicators’ Point of View
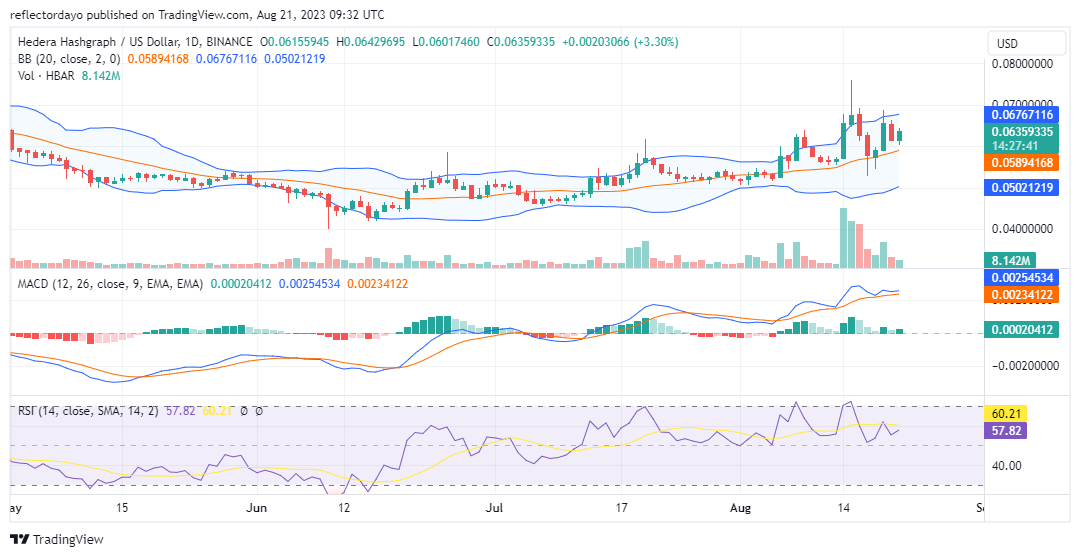
According to the Bollinger Bands indicator, the price channel continues to exhibit an upward movement, with the support level positioned above the 20-day moving average. On August 15, the market reached a peak of $0.076, followed by a bearish market trigger. This robust bullish action heightened market volatility and prompted a bearish response. However, this bearish response lacked the strength to drive the lower band of the Bollinger Bands downward. As a result, the advantage still remains with the bulls in the market.
Contrarily, as per the Moving Average Convergence and Divergence (MACD) indicator, the smaller and fading green histograms suggest diminishing bullish momentum. However, the bear market also has declining momentum. This hints at the market stabilizing, coinciding with a decrease in trade volume.
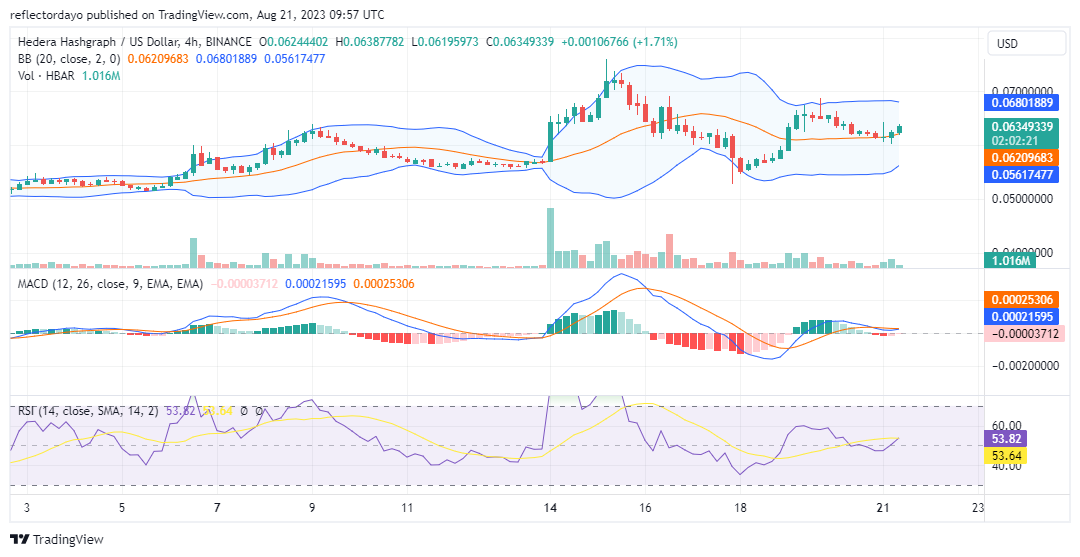
HBAR/USD 4-Hour Chart Outlook
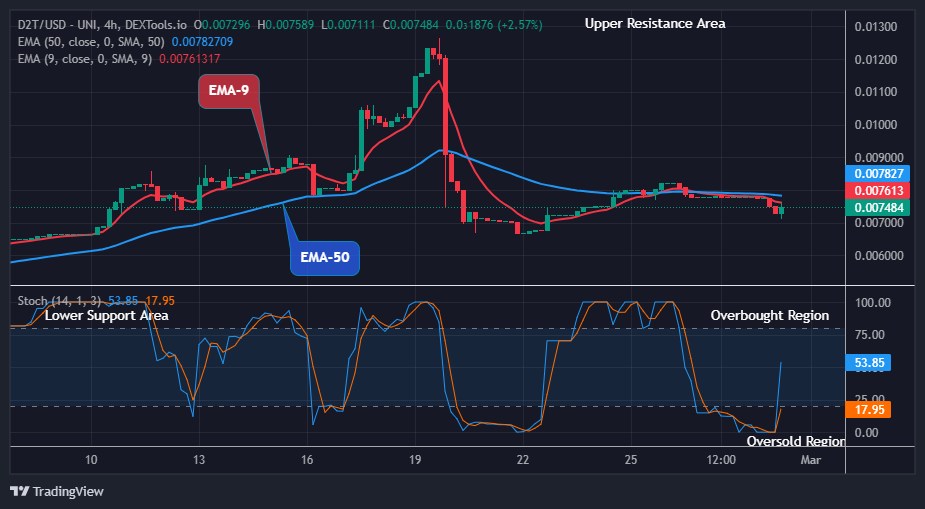
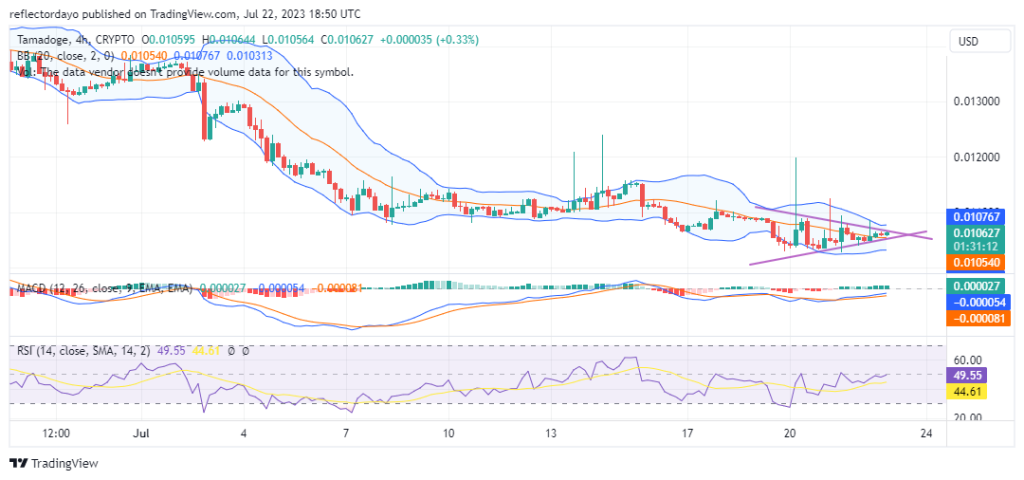
On the 4-hour chart, the market is diverging from its equilibrium state, evident in the Relative Strength Index (RSI), where the RSI line currently reads 54.11. Additionally, within the Bollinger Bands indicator, the price action has recently deviated from the 20-day moving average by a small margin of just $0.001. However, the Moving Average Convergence and Divergence (MACD) indicator, being a slower-moving indicator, suggests that the market may still be in a state of equilibrium. One advantage of the MACD indicator lies in its ability to identify false signals, but its downside is that it might cause investors to miss an opportune time to enter a particular trading position. Consequently, investors might consider waiting for confirmation from the MACD indicator before making decisions.