Polkadot Recoups above $4.20 As It Indicates a Likely Bounce
Estimated Reading Time: 2 minutes
Don’t invest unless you’re prepared to lose all the money you invest. This is a high-risk investment and you are unlikely to be protected if something goes wrong. Take 2 minutes to learn more

Polkadot (DOT) Long-Term Analysis: Bearish
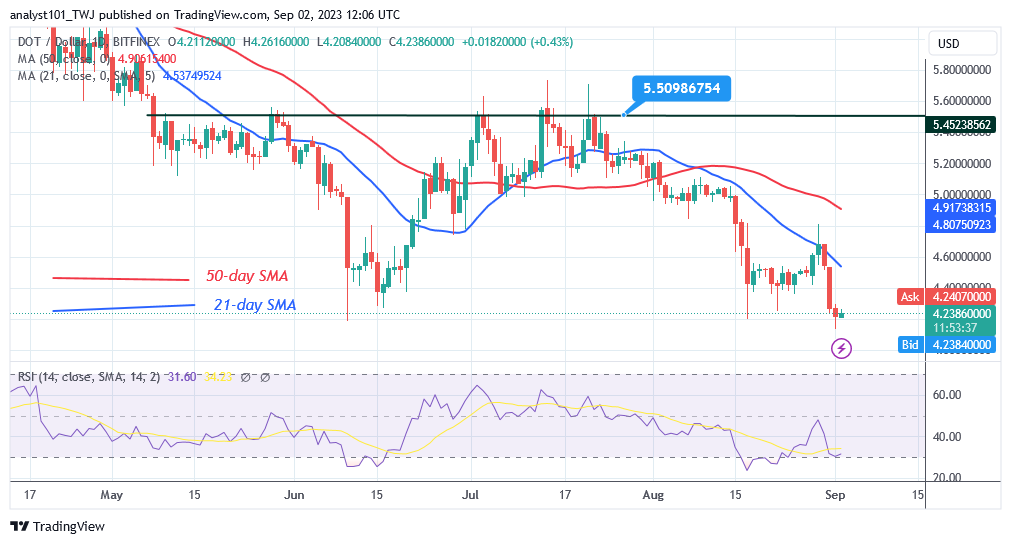
Polkadot’s (DOT) price movement has been constrained below the moving average lines as it indicates a likely bounce. The moving average lines are limiting the upward movement. The resistance at $4.80 and the 21-day SMA denied the rally on August 29.On the plus side, the bears are active at higher price levels.
Following the rejection at $4.80, the DOT price has dropped to a low of $4.13. If the current support holds, the crypto asset will be forced to move in a band between $4.20 and $4.80. The altcoin has dropped and is now trading in the market’s oversold zone. Long candlestick tails indicate substantial buying at lower prices.
Technical indicators:
Major Resistance Levels – $10, $12, $14
Major Support Levels – $8, $6, $4
Polkadot (DOT) Indicator Analysis
Polkadot has dropped to the Relative Strength Index level of 32 for period 14. As a result of the recent rejection, the altcoin is in a bearish trend zone. The current decline in the value of the crypto is caused by the price bars being below the moving average lines. When price bars continue above the moving average lines, the altcoin will rise.
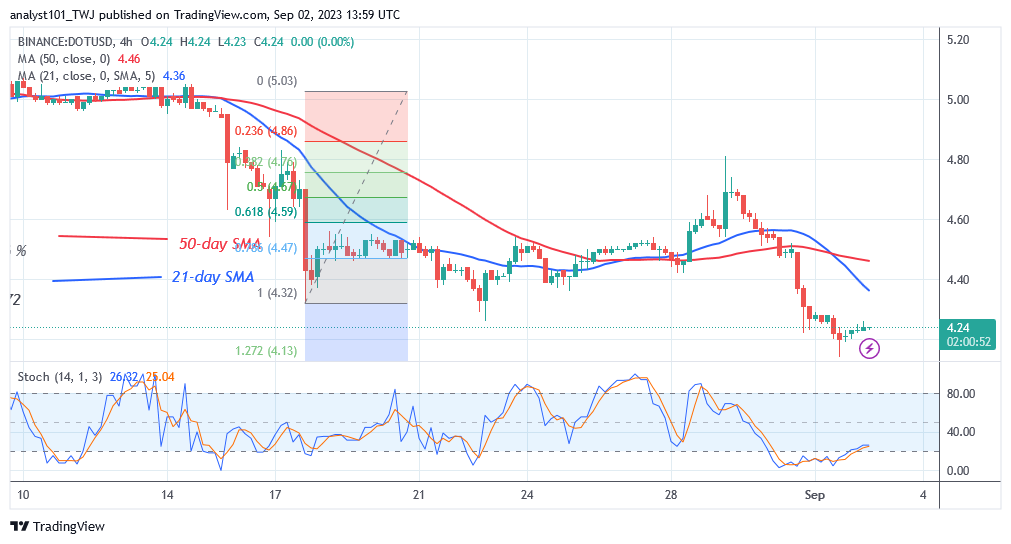
The cryptocurrency is surging after reaching the market’s oversold zone. It is higher than the daily Stochastic level of 25.
What Is the Next Direction for Polkadot (DOT)?
Polkadot is rising after returning to its prior low of $4.20 as it indicates a likely bounce. Bulls pounced when the market hit a low of $4.13. The market will continue to be in range-bound move as long as the range bound levels hold. Polkadot should have reversed in the market’s oversold area. The predicted price range for the altcoin is $4.20 to $4.80.
You can purchase Lucky Block here. Buy LBLOCK
Note: Cryptosignals.org is not a financial advisor. Do your research before investing your funds in any financial asset or presented product or event. We are not responsible for your investing results