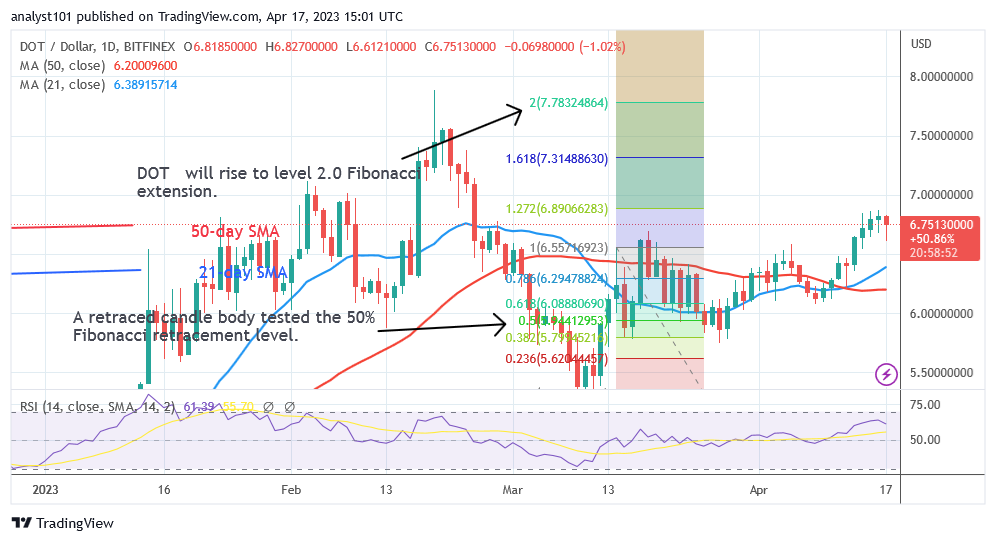
Wall Street Memes (WSM) Prices Stay On: Revamping Spirals
Estimated Reading Time: 3 minutes
Don’t invest unless you’re prepared to lose all the money you invest. This is a high-risk investment and you are unlikely to be protected if something goes wrong. Take 2 minutes to learn more

Wall Street Memes Price Prediction – April 3
Some pricing activities have kept re-occurring to weakly dowse the muscling efforts being established by the WSM/USD market long-term position movers, as even the financial trading status of the base instrument shows that the prices stay positive, revamping their inputs in spirals.
In anticipation of a sustained bullish reversal in the given trading pair, it is now evident that momentum oscillations, liquidity flows, and volatility spikes are being tactically generated on a daily basis. These accumulation phases and price retracements create strategic opportunities for purchasers to secure optimal support-level entries ahead of imminent breakout movements within the trading cycle.
WSM/USD Market
Key Levels
Resistance levels: $0.0015, $0.002, $0.0025
Support levels: $0.0008, $0.0006, $0.0004
WSM/USD – 4-hour Chart
The WSM/USD medium-term chart reveals that the crypto-economic markets stay on, making a situation for revamping spirals.
A prolonged horizontal consolidation pattern has formed, with candlesticks aligning along the Bollinger Bands’ trend near the $0.001 level. Meanwhile, the stochastic oscillators maintain a northbound slant, indicating growing bullish momentum and increasing opportunities for strategic buy positions.
Would it be strategically viable to sustain buy orders near the lower Bollinger Band threshold at this stage, considering prevailing market conditions?
It has just been a matter of having the situation to propel steady upward movements in the business operations of the WSM/USD trade, as the report has it that the crypto-economic markets stay on, revamping spirals in its inputs.
Market activity remains concentrated in lower zones, with both bulls and bears contending around the critical $0.001 level, which serves as the primary trade benchmark for potential upward movements. A strong bullish candlestick formation could signal the beginning of sustained upward momentum, leading to more stable bullish trends over time.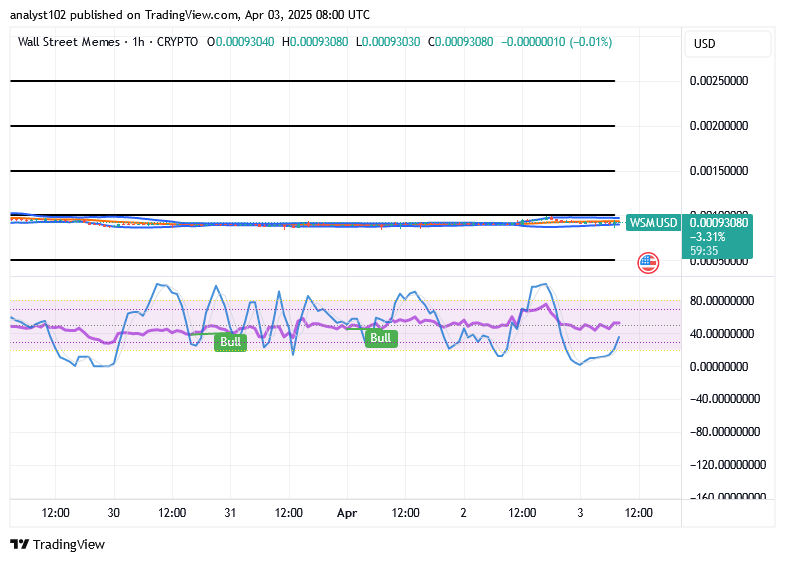
WSM/USD 1-hour chart
The WSM/USD 1-hour chart showcases that the short-term transaction line of the base crypto trades stays on, revamping spirals in its outlook.
The stochastic oscillators indicate increasing volatility, suggesting that buying momentum is poised to strengthen over the long term. Meanwhile, the Bollinger Bands remain extended horizontally, with price action maintaining a low trajectory below the $0.001 level, signaling a period of consolidation before a potential breakout.
$WSM / $USDT is now officially tradeable on #Bybit Perpetual Contracts.
$WSM community, we saw your Tweets! 👏$WSM / $USDT is now tradeable on #Bybit Perpetuals.
— Bybit (@Bybit_Official) October 13, 2023
Trade here: https://t.co/le4XyVyXaZ
Also want your project listed? Share your suggestions here:https://t.co/W7EWJVVNV5 https://t.co/XgXoL7g0rF
Buy and stake WSM now! https://wallstmemes.com/