Polkadot (DOT/USDT) Prepares for a Break Above $4.929 Dynamic Level
Estimated Reading Time: 3 minutes
Don’t invest unless you’re prepared to lose all the money you invest. This is a high-risk investment and you are unlikely to be protected if something goes wrong. Take 2 minutes to learn more
Polkadot Long-term Analysis: Bullish
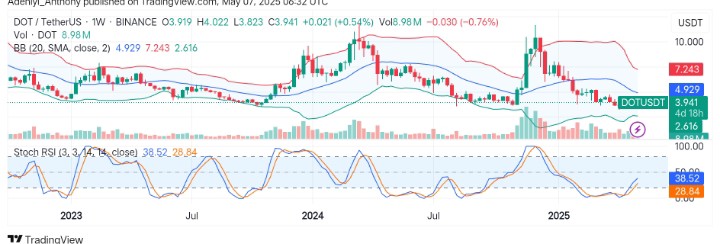
The market for Polkadot against the Tether is displaying a sign of a potential move to the north after prolonged bearish pressure that started in late last year. The pair has been falling below supports with failed attempts at stabilization. However, with the current uptick in volume suggesting accumulation at the current level, DOT movement hints at a nice reversal play above $4.929 if the momentum holds.
Recently, the weekly momentum oscillator beneath the chart signals a move from the oversold region, suggesting a potential upside movement as the pair sees a minor 0.54% gain.
Currently, Polkadot trades at $3.941, recording 8.98 million weekly traded volumes.
Technical Indicators
Major Resistance Levels: $4.929, $5.900, and $7.243
Major Support Levels: $3.700, $2.616, and $2.000
Polkadot Technical Analysis
The analysis of Polkadot against the Tether on the weekly chart shows that the pair opened at $3.919, and it is currently trading near the lower Bollinger band with the aim of reaching the dynamic $4.929 level.
Moreover, the Stochastic RSI shows the pair is prepared for a classical early long position as the trading volume sees a slight increase. This suggests that after a clear downtrend, the pair might be attempting a bounce to the north.
To this end, the pair must break above $4.000 with more volume for a trajectory towards $4.929 or $5.900 to materialize. Conversely, a break below $3.700 may result in a short-term decline.
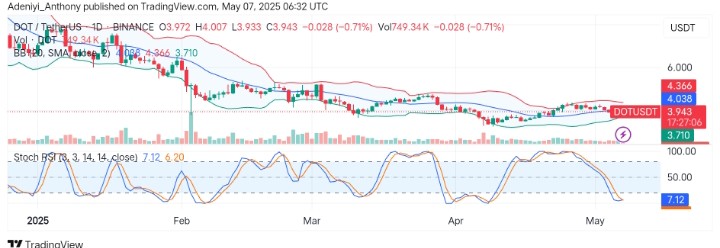
DOT/USDT Analysis: A Bounce or Breakdown?
On the daily timeframe, DOT/USDT appears to be trading within a tightening range after several failed breakout attempts. However, the price faces headwinds as bearish momentum resurfaces after a clear rejection around the $4.000 level.
From another angle, the volume is thinning out with the oscillator abruptly crossing to the south from the overbought level, pointing to fading momentum.
To this end, DOT may see further downward movement if the $3.700 level is breached, with $3.200 as the target. Conversely, a renewed bullish interest may push the price above $4.051, which invalidates a downplay play.
You can purchase crypto coins here. Buy LBlock