SPONGE/USD ($SPONGE) Buying Activities Triggered Below $0.00011
Estimated Reading Time: 3 minutes
Don’t invest unless you’re prepared to lose all the money you invest. This is a high-risk investment and you are unlikely to be protected if something goes wrong. Take 2 minutes to learn more

Following the aimless drift of the $SPONGE market, the bearish trend succeeded in pushing the market downward. As the market gained momentum in the downward direction, the price started approaching the $0.00010 price level. This particular level serves as a strong support zone, which explains why the price rebounded as soon as the market touched $0.0001021.
Key Levels
- Resistance: $0.0004, $0.0045, and $0.0005.
- Support: $0.00011, $0.00010, and $0.00009.
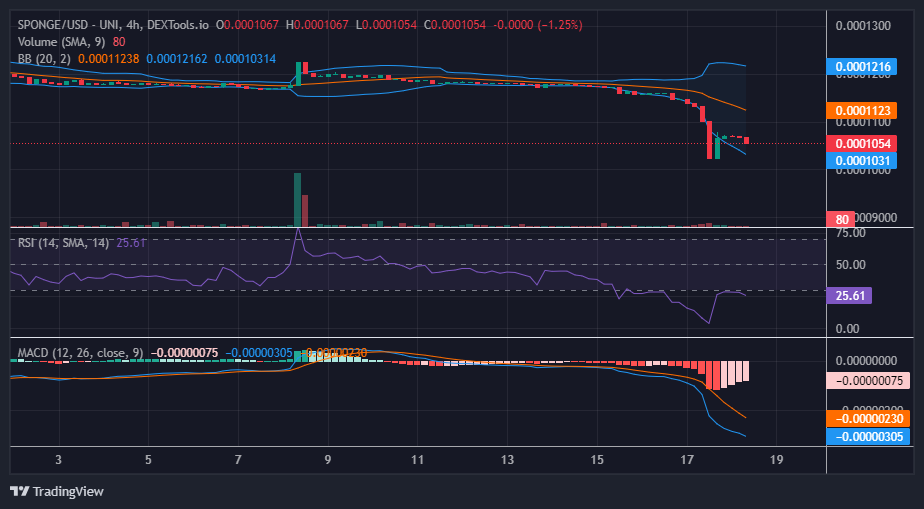
Sponge (SPONGE/USD) Price Analysis: The Indicators’ Point of View
During the $SPONGE market’s upward surge, it encountered robust resistance at the $0.0001071 price level. This is a significant concern, as the presence of resistance at the $0.0001071 price level indicates that sellers have established control over the $0.000110 price level. However, if the bulls manage to overcome the $0.0001071 resistance level, they are likely to retake the $0.000110 price level.
According to the Relative Strength Index (RSI) and the Moving Average Convergence and Divergence (MACD) indicator, the market remains within oversold territory due to the ongoing selling pressure. Nevertheless, there is a glimmer of hope from the Moving Average Convergence and Divergence indicator, as the negative histograms are starting to appear in a faded red hue, suggesting that bullish momentum might be building up.
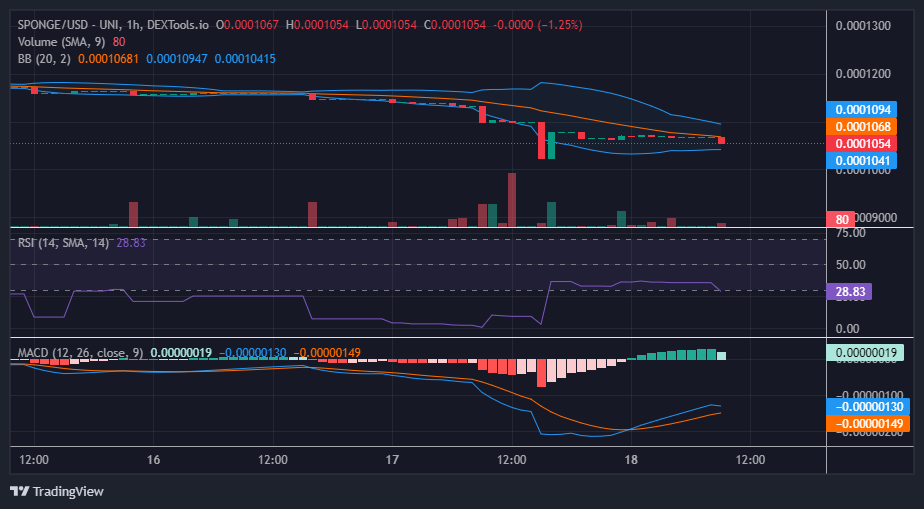
$SPONGE Short-Term Outlook: 1-Hour Chart
On the 1-hour chart, a noticeable increase in bullish pressure becomes evident within the bull market. This is observed as the Bollinger Bands start to converge amidst the sideways movement around the $0.000107 price level. The Moving Average Convergence and Divergence (MACD) indicator also shows the emergence of a bullish histogram. However, the most recent candlestick is bearish. Despite this, as long as the price action stays within the boundaries defined by the Bollinger Bands indicator, the market has not yet exhibited a break in the bearish direction.
Buy SPONGE/USD and soak up the damp.
When you wake up to see that…
The #Bitcoin price has gone to the moon!🌕💰🚀 pic.twitter.com/pd7YnjrPuq
— $SPONGE (@spongeoneth) August 18, 2023
Invest in the hottest and best meme coin. Buy Sponge ($SPONGE) today!