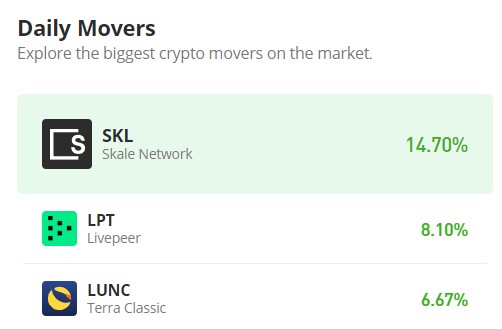
Livepeer (LPT/USD) Is Poised to Break Through $8.00 Barrier Soon
Estimated Reading Time: 2 minutes
Don’t invest unless you’re prepared to lose all the money you invest. This is a high-risk investment and you are unlikely to be protected if something goes wrong. Take 2 minutes to learn more
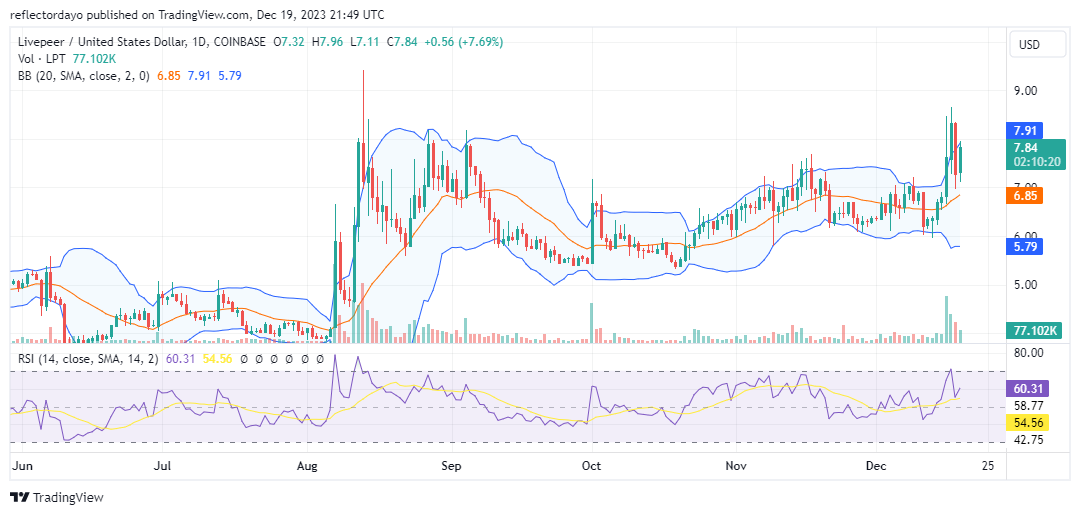
In November, Livepeer aimed for the $8.00 price level during its bullish trend. However, as bearish sentiment intensified near this mark, the market retreated to $7.80. This prompted bullish traders to refocus their efforts around the critical $6.00 price level, which has since served as a key support, guiding the market towards its objective.
Livepeer Market Data
- LPT/USD Price Now: $7.84
- LPT/USD Market Cap: $234,014,741
- LPT/USD Circulating Supply: 30,101,925 LPT
- LPT/USD Total Supply: 301,101,925 LPT
- LPT/USD CoinMarketCap Ranking: #189
Key Levels
- Resistance: $8.00, $8.50, and $9.00.
- Support: $6.50, $5.00, and $4.50.
Livepeer Market Forecast: Analyzing the Indicators
The support level at $6.00, which stands higher than the previous support at $5.40, effectively countered the bearish trend that originated from the $7.80 mark. This led to a period of price consolidation, albeit with significant volatility. By mid-December, a strong Livepeer bullish sentiment emerged, pushing the price past the pivotal $8.00 resistance level. However, the price failed to maintain its position above this key resistance and subsequently dropped back below $8.00. Current market trends indicate a potential bullish rebound, but the declining trade volume suggests that the bulls might encounter challenges in surpassing the $8.00 mark again.
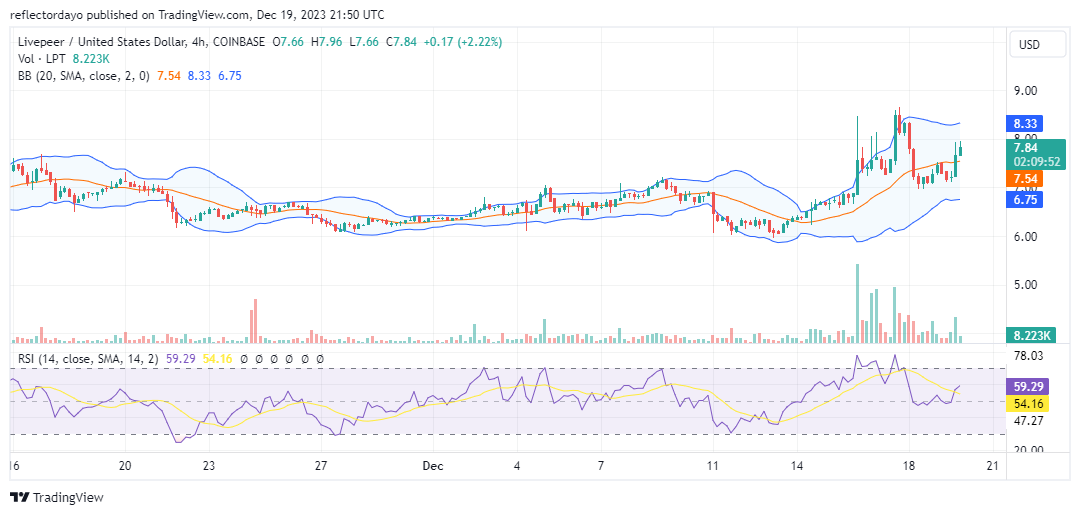
LPT/USD 4-Hour Chart Outlook
From a 4-hour chart perspective, the Bollinger Bands indicator reveals a significant bandwidth as both the upper and lower standard deviations move sideways, indicating a horizontal price channel. Additionally, it is evident that bears have converged around the $8.00 mark, resisting the bullish momentum seen in both recent days. Given the simultaneous advancement of the resistance and support levels, there is a potential for price consolidation around the $7.50 mark.