Biconomy (BICO/USD) Surges Past $0.35 Milestone, Aims for $0.400 Next
Estimated Reading Time: 2 minutes
Don’t invest unless you’re prepared to lose all the money you invest. This is a high-risk investment and you are unlikely to be protected if something goes wrong. Take 2 minutes to learn more
On December 11, the Biconomy market reached the $0.35 price level, encountering significant resistance. On December 12, the trading session witnessed substantial fluctuations between demand and supply, yet the price remained relatively stable around $0.35. For several subsequent days, the market remained stagnant at this level. However, today’s trading session demonstrates a strong bullish sentiment, pushing the price towards the $0.40 threshold.
Biconomy Market Data
- BICO/USD Price Now: $0.38
- BICO/USD Market Cap: $225,771,573
- BICO/USD Circulating Supply: 590,210,568 BICO
- BICO/USD Total Supply: 1,000,000,000 BICO
- BICO/USD CoinMarketCap Ranking: #177
Key Levels
- Resistance: $0.42, $0.45, and $0.50.
- Support: $0.30, $0.25, and $0.20.
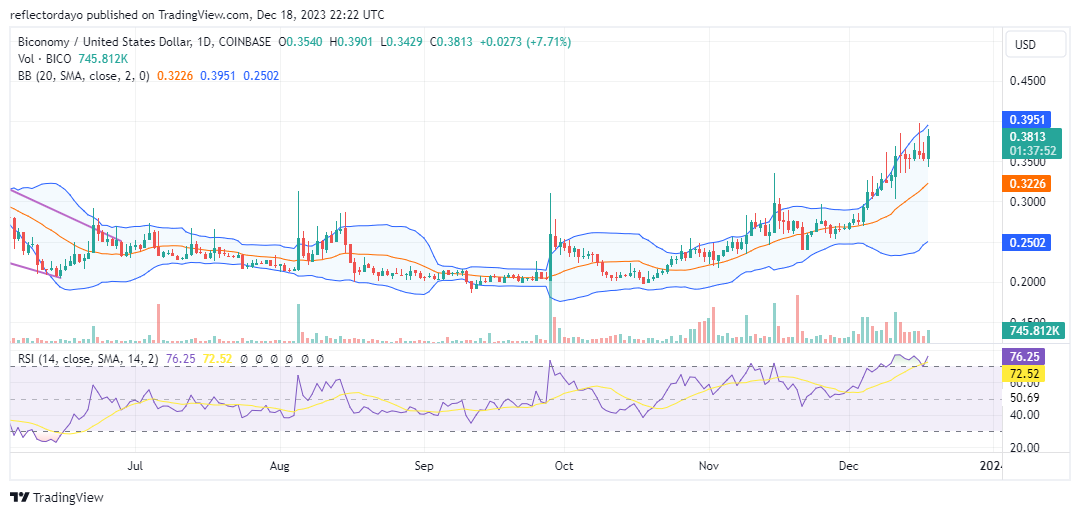
Biconomy Market Forecast: Analyzing the Indicators
The Bollinger Bands indicator suggests a bullish market trend. The Biconomy price began its upward momentum in October, starting at $0.20 and gradually ascending. By December, the bullish momentum intensified, with the price nearing the $0.40 mark, albeit briefly pausing at $0.35. According to the Bollinger Bands indicator, both the two-standard deviation and the 20-day moving average are trending upward. This aligns with a robust bullish signal. Additionally, the volume of trade indicator shows substantial trading volume, further reinforcing the current bullish trend.
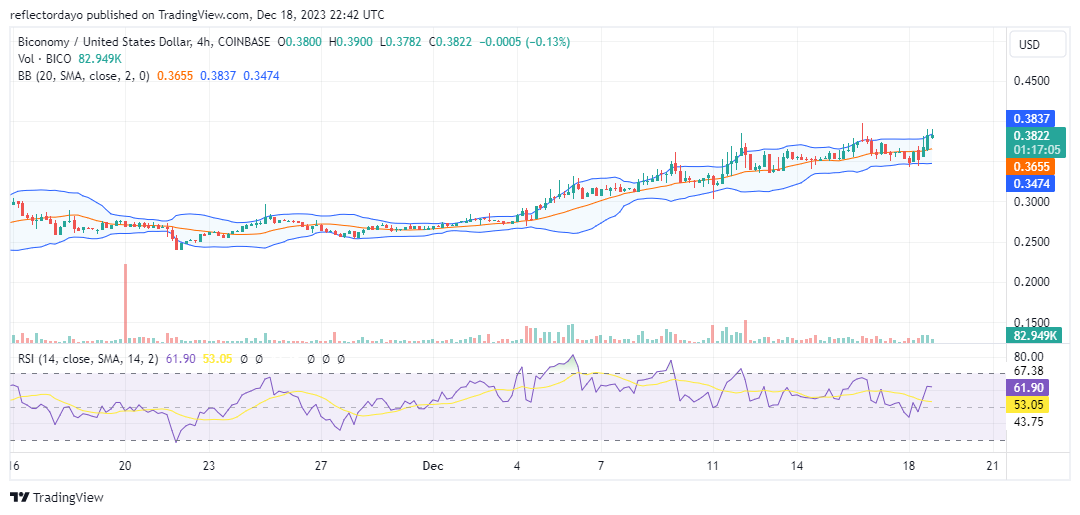
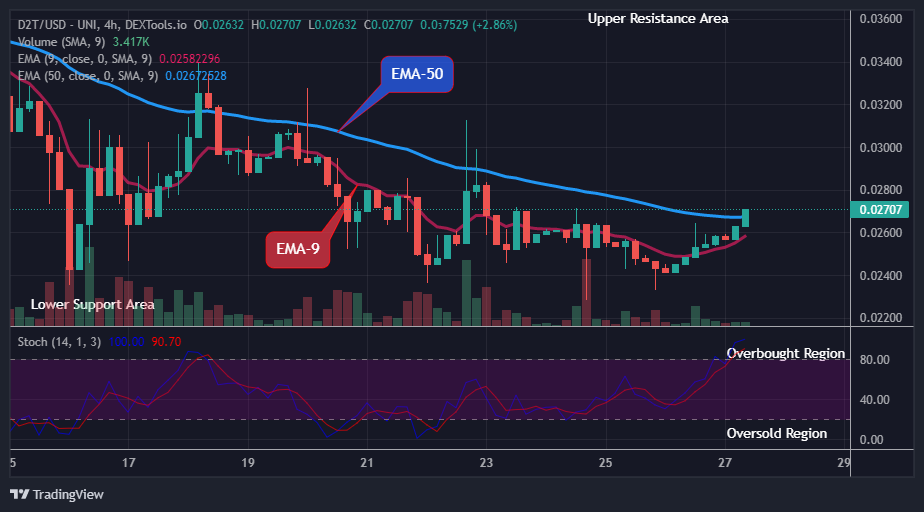
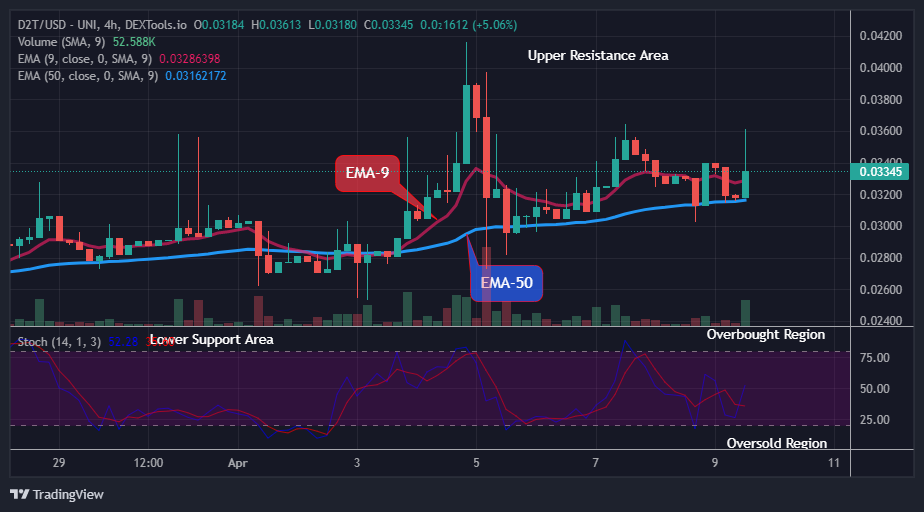
BICO/USD 4-Hour Chart Outlook
Based on the 4-hour chart analysis, the Biconomy market consistently establishes higher highs, indicating that the robust bullish trend is suppressing bearish sentiment, with the market edging closer to the $0.40 price level. The Relative Strength Index (RSI) registers a momentum of 61, suggesting potential for further bullish activities. It appears that the market is poised to approach the $0.40 price target in the near term.