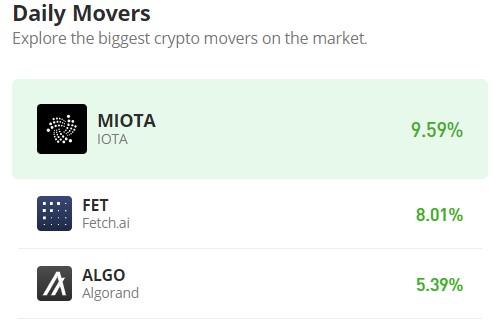
Fetch.ai (FET/USD) Breaks Out, Price Surging Towards $0.700
Estimated Reading Time: 3 minutes
Don’t invest unless you’re prepared to lose all the money you invest. This is a high-risk investment and you are unlikely to be protected if something goes wrong. Take 2 minutes to learn more
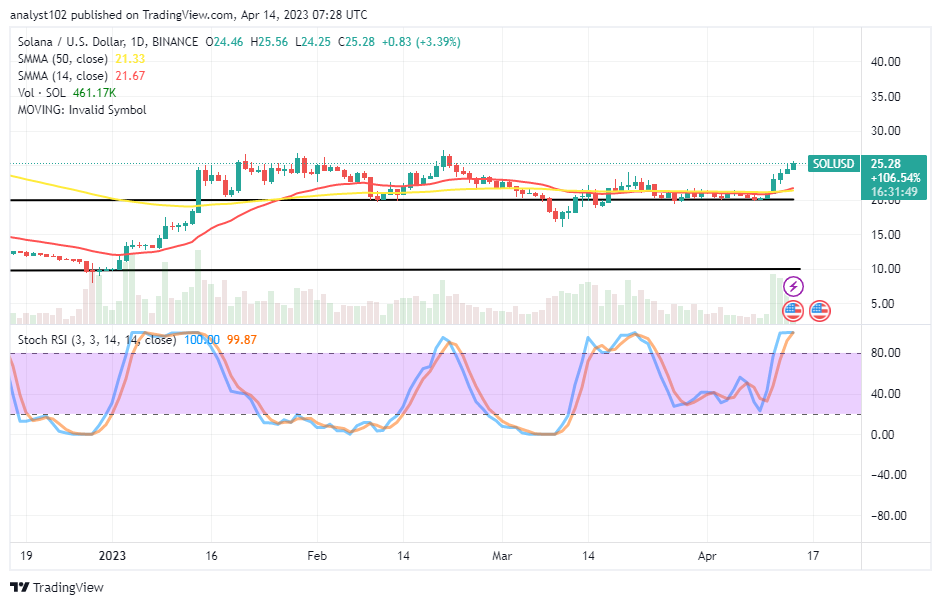
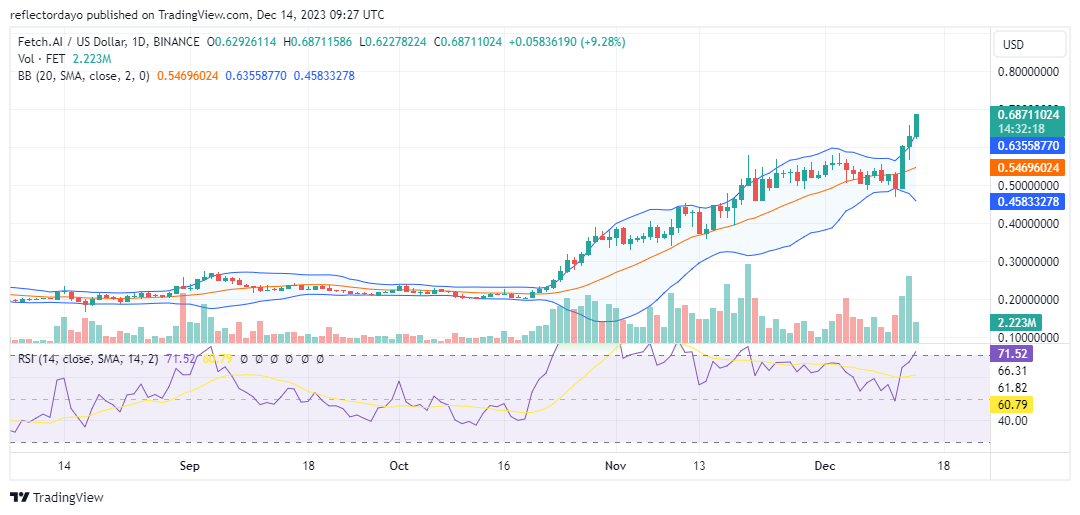
In November, the ascending trend of the Fetch.ai market found stability above the $0.500 price level, following a notable bearish sentiment within this range. Throughout December, the market underwent a consolidation phase. However, with bullish traders leveraging the $0.500 price level as a support base, there was a substantial rally in prices, effectively overcoming the prior deadlock and effortlessly surpassing the $0.6 price level. Presently, the market is poised for further advancement, targeting the $0.70 price level.
Fetch.ai Market Data
- FET/USD Price Now: $0.68
- FET/USD Market Cap: $561,796,403
- FET/USD Circulating Supply: 824,091,047 FET
- FET/USD Total Supply: 1,152,997,575 FET
- FET/USD CoinMarketCap Ranking: #97
Key Levels
- Resistance: $0.70, $0.75, and $0.80.
- Support: $0.55, $0.60, and $0.65.
Fetch.ai Market Forecast: Analyzing the Indicators
Over the past three days, Fetch.ai has exhibited a pronounced bullish trend, accompanied by a notable surge in trade volume, substantiating the strength of the bullish momentum. The substantial trading activities, as indicated by the Volume of Trade indicator, imply a potential attainment of the $0.7 target, and there is even a possibility of surpassing the $0.70 threshold.
The Relative Strength Index (RSI) underscores the robust bullish momentum, registering at a level of 71. The heightened demand in the market is propelling it towards the overbought region on the RSI. Concurrently, the Bollinger Bands indicator indicates increasing volatility, suggesting that the bull market may encounter significant resistance at the $0.700 level. Consequently, traders are advised to remain vigilant in this vicinity.
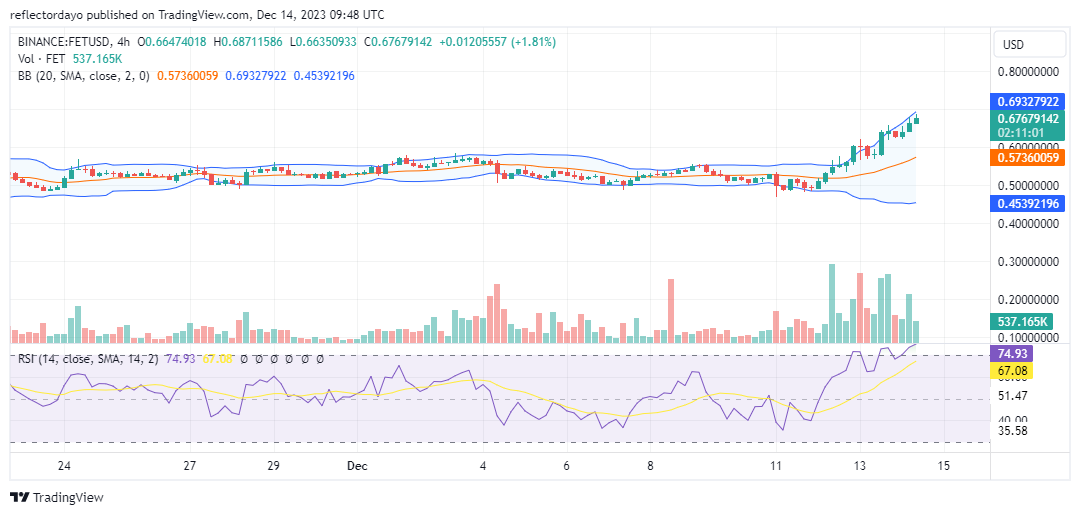
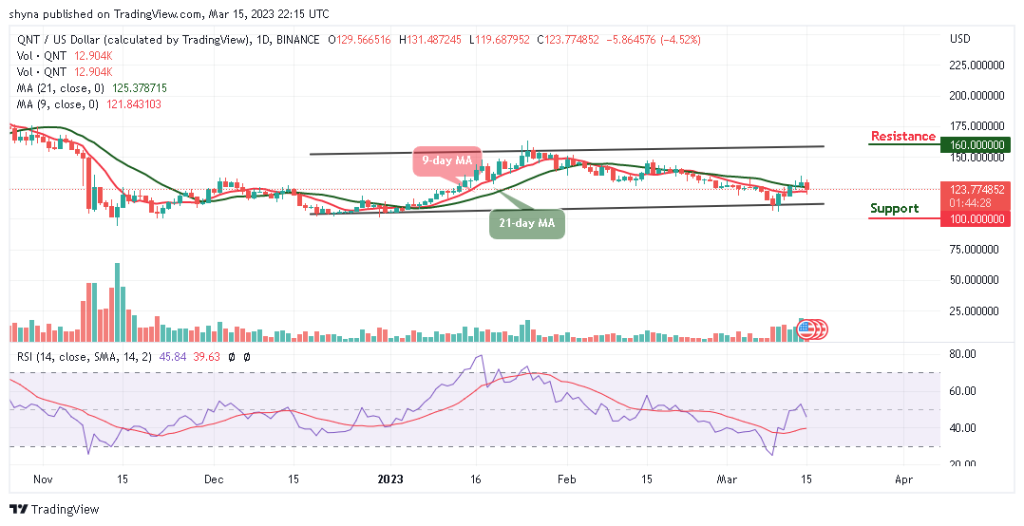
FET/USD 4-Hour Chart Outlook
Analyzing the 4-hour chart’s Bollinger Bands, there are opportunities for further bullish momentum. Bullish activities have caused an upward divergence in the upper standard deviation of the Bollinger Bands, while the lower standard deviation maintains a horizontal trajectory. The upward divergence in the upper bands indicates increased volatility in the bullish market. Conversely, the lack of movement in the lower bands suggests limited activity in the bear market, resulting in minimal divergence.
This market dynamic strongly supports a bullish trend, as the upward divergence and increased volatility in the upper bands signify a prevailing bullish sentiment.