The Storj Market (STORJ/USD) Reclaims Midrange Dominance, Rejecting Bearish Pressures Below $0.70
Estimated Reading Time: 3 minutes
Don’t invest unless you’re prepared to lose all the money you invest. This is a high-risk investment and you are unlikely to be protected if something goes wrong. Take 2 minutes to learn more
During the initial half of November, the Storj market witnessed a substantial surge in bullish activity within a brief three-day period. Notably, the market experienced a remarkable ascent, moving from $0.45 to above the $0.90 level. Initial observations led to an expectation of an imminent robust bearish trend following this bullish momentum. While there was a rapid decline in price, attributed to profit-taking by numerous traders, the prevailing bullish sentiment within the market curtailed the development of a pronounced bear market, stabilizing around the $0.7 price zone.
Storj Market Data
- STORJ/USD Price Now: $0.721
- STORJ/USD Market Cap: $279,597,071
- STORJ/USD Circulating Supply: 385,567,933 STORJ
- STORJ/USD Total Supply: 424,999,998 STORJ
- STORJ/USD CoinMarketCap Ranking: #158
Key Levels
- Resistance: $0.75, $0.80, and $0.85.
- Support: $0.65, $0.60, and $0.55.
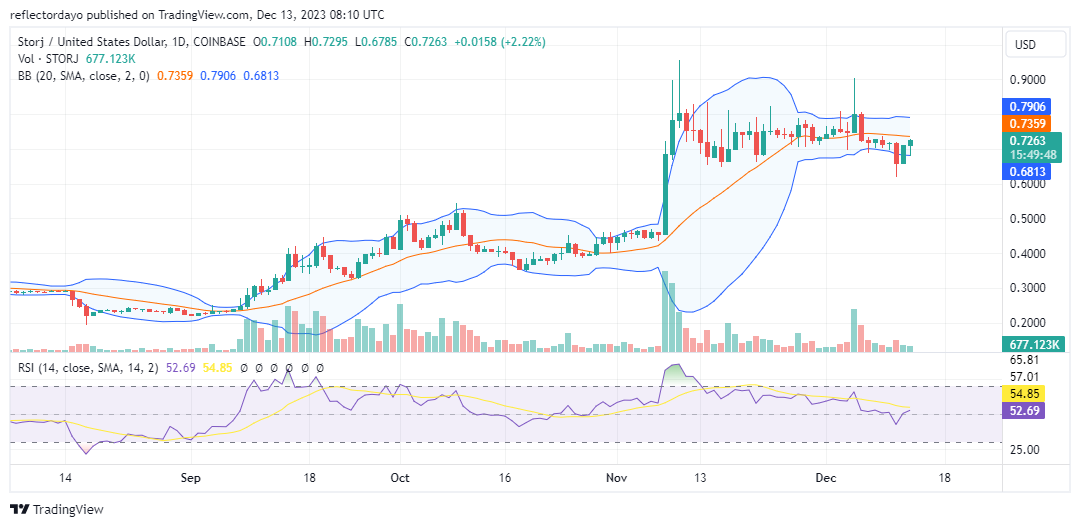
The Storj Market Price Forecast: Analyzing the Indicators
The persistent bullish sentiment continues to exert strength, effectively confining the aggressive bear market within a consolidation trend since the first half of November. Amidst an ongoing struggle between demand and supply within the $0.70 price zone, indications from the Bollinger Bands point towards a reduction in volatility levels. The bands have converged, forming a horizontally moving price channel.
Although a recent bearish breakout occurred, driving the Storj market down to $0.628, it proved to be unsustainable. The bulls orchestrated a rally, propelling the market back into the $0.70 price zone and ultimately stabilizing the market at equilibrium. An additional noteworthy development for investors is the emergence of a hammer candlestick in today’s trading session, signaling that buyers are actively intervening, rejecting lower prices, and propelling the market upwards. The appearance of the hammer can be interpreted as a bullish sign.
However, investors are advised to remain vigilant for a potential market breakthrough above the 20-day moving average, as this would serve to confirm the aforementioned observations.
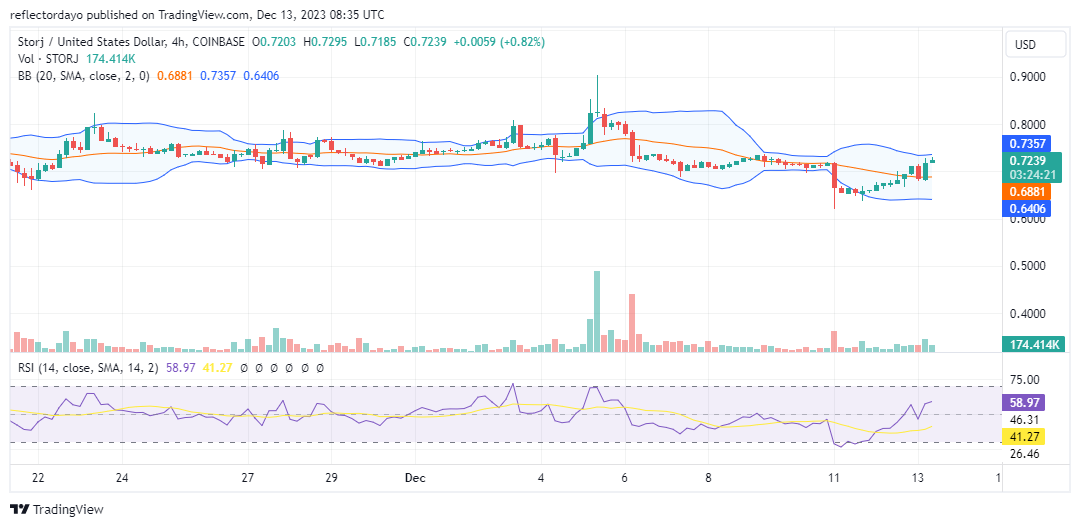
STORJ/USD 4-Hour Chart Outlook
On the 4-hour timeframe, there is discernible upward momentum in the bull market, approaching the $0.80 price threshold. However, it is noteworthy that the volume of trade indicator exhibits relatively small histograms. The presence of diminutive histograms in the volume of trade indicator implies a lack of strong conviction in the current trend. Traders are advised to exercise caution, given that the volume of trade reflects the level of trading activities supporting the upward movement of prices.
An alternative interpretation of the market suggests the potential influence of influential traders attempting to propel the market upward. This dynamic can contribute to a bullish trend, with an increasing number of traders likely to join the upward movement, thereby causing a substantial rise in prices. Traders should remain vigilant to evolving market dynamics and consider the possible impact of influential participants on the overall trend.