Polkadot Retraces but Holds below the $7.50 High
Estimated Reading Time: 2 minutes
Don’t invest unless you’re prepared to lose all the money you invest. This is a high-risk investment and you are unlikely to be protected if something goes wrong. Take 2 minutes to learn more
Polkadot (DOT) Long-Term Analysis: Bullish
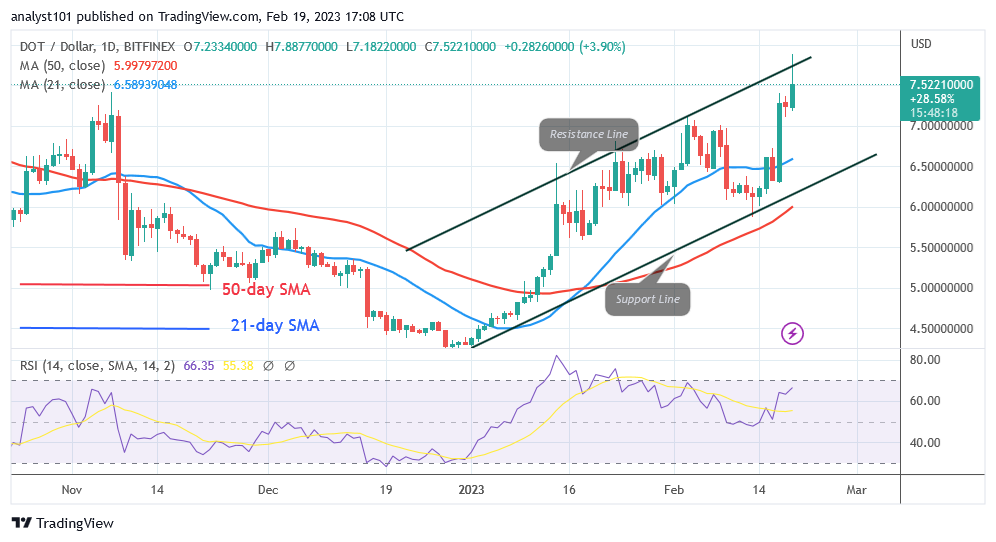
Polkadot (DOT), which surged to a high of $7.88, is currently trading below the $7.50 high. The price level right now corresponds to the historical price level from September 9, 2022. If buyers can sustain the price above the $8.00 resistance level, the altcoin will increase to a high of $9.50. Yet, given that the market is getting close to being overbought, additional higher movement is improbable. If the altcoin is rejected at the current high, its price will fall. The market will start to decline if it rises above $6.50 or the 21-day line SMA.
Polkadot (DOT) Indicator Analysis
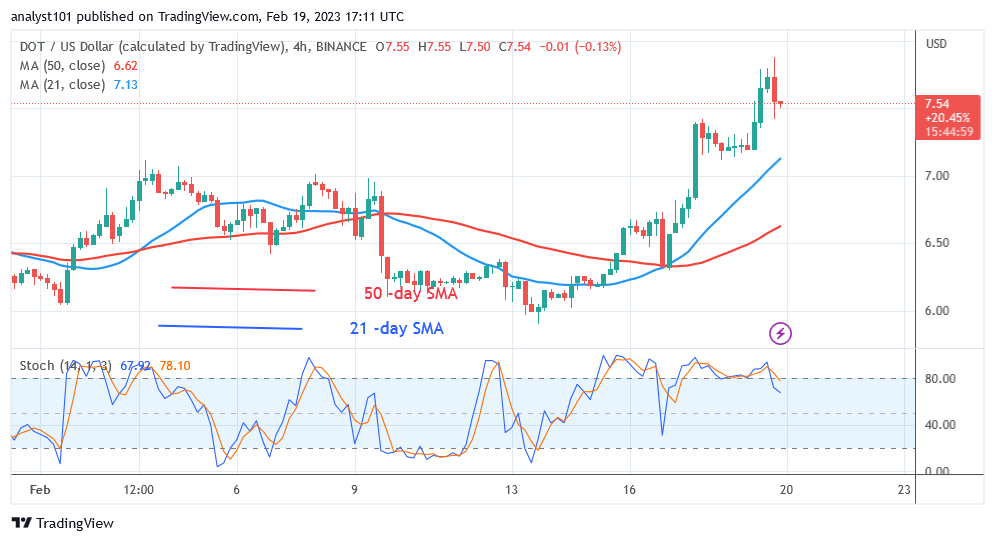
At level 66 of the Relative Strength Index for period 14, Polkadot is in the uptrend zone. Although the altcoin is gaining, the market is very close to being overbought. The coin is overbought, according to the daily Stochastic. The daily Stochastic is below level 80, which points to a potential decrease in the value of the cryptocurrency. The moving average lines are above the price bars, indicating that the price of the cryptocurrency will increase.
Technical indicators:
Major Resistance Levels – $10, $12, $14
Major Support Levels – $8, $6, $4
What Is the Next Direction for Polkadot (DOT)?
Polkadot is being rejected at its most recent high even though it is trading below the $7.50 high. After reaching an overbought area, the coin is now retracing. If the crypto asset retraces and finds support above the moving average lines, the rally will continue. The price will restart its downward trend if it falls below the 21-day line SMA.
You can purchase Lucky Block here. Buy LBLOCK
Note: Cryptosignals.org is not a 1a financial advisor. Do your research before investing your funds in any financial asset or presented product or event. We are not responsible for your investing results