Bitcoin (BTC/USD) Price Sets on a Rising Motion
Estimated Reading Time: 3 minutes
Don’t invest unless you’re prepared to lose all the money you invest. This is a high-risk investment and you are unlikely to be protected if something goes wrong. Take 2 minutes to learn more
Bitcoin Price Prediction – July 22
The BTC/USD price sets on a rising motion as the crypto’s valuation trades around the line of $32,488. The market witnesses a percentage rate of about 1.02 increments.
BTC/USD Market
Key Levels:
Resistance levels: $35,000, $40,000, $45,000
Support levels: $30,000, $27,500, $25,000
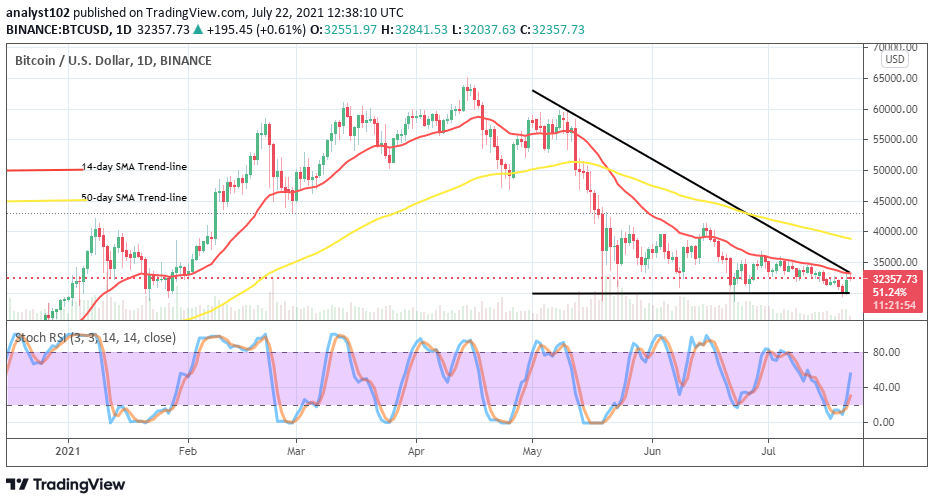
BTC/USD – Daily Chart
On the BTC/USD daily chart, the crypto’s price sets on a rising motion during yesterday’s session. A bullish candlestick emerged to engulf a couple of smaller bearish candlesticks formed in the days’ sessions before it. The 50-day SMA indicator is over the 14-day SMA indicator as the critical support baseline remains drawn at the level of $30,000. The Stochastic Oscillators have swerved northbound from the oversold region, suggesting an upside return in the market. Therefore, the market valuation of the US Dollar appears losing grand as the counter trading instrument of the crypto.
As price sets on a rising motion, will the BTC/USD market keep it beyond the level of $35,000?
The crypto economy’s journey to the downside appears exhausted as the BTC/USD’s price sets on a rising motion. The market level at $35,000 will breach northward while yesterday’s uprise continually enjoys beefing up of the energy by bulls. However, the occurrence of pit stops during the movement toward the point could cause a slight decline in the recovery bid of the crypto. In the meantime, bulls are most likely to enjoy the market’s ride at the expense of a downward weakness.
On the contrary to the upside, a sharp reversal of the current recuperating efforts made by bulls needed against the critical support baseline at $30,000. If that heightened, the crypto economy may resume a cheap sell-off trading situation that could eventually bring about an uglier valuation surpassing the previous points on the record. A short-pulling down motion may not be a good sign of achieving that trading scenario.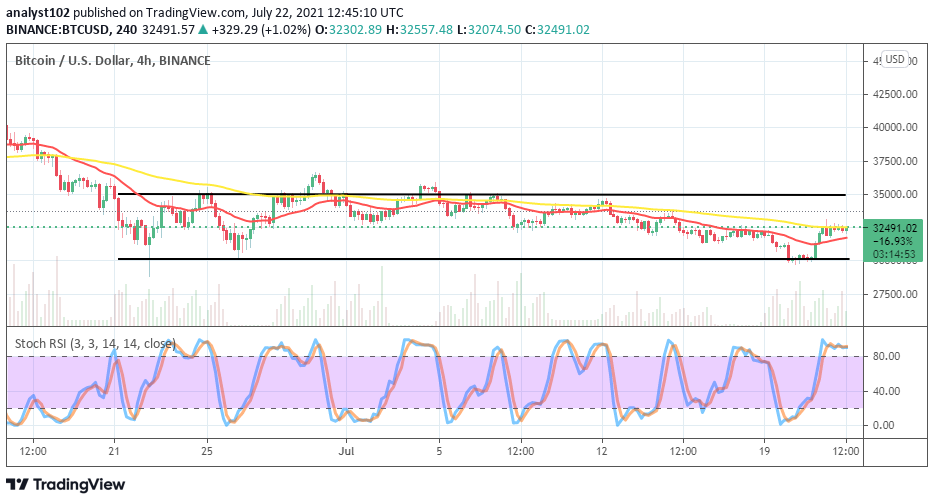
BTC/USD 4-hour Chart
The first eye-catching technical analyzing tool on the BTC/USD medium-term chart is the readings of the Stochastic Oscillators that state an overbought trading condition of the crypto economy. And, that voluminously augurs that the movement to the north lacks the energy to sustain pushing further. Another aspect is that the crypto market is somewhat pushing in two conjoined-differential range zones of $35,000, $32,500 and, $30,000. The 50-day SMA is over the 14-day SMA. There may soon be a consolidation of price around the mid-value of the range line. A forceful break out at the upper range line is highly demanding to suffice more ups aftermath.
Note: Cryptosignals.org is not a financial advisor. Do your research before investing your funds in any financial asset or presented product or event. We are not responsible for your investing results.
You can purchase crypto coins here. Buy Tokens