Arbitrum Price Prediction: ARB/USD Ready to Break $0.85 Level
Estimated Reading Time: 3 minutes
Don’t invest unless you’re prepared to lose all the money you invest. This is a high-risk investment and you are unlikely to be protected if something goes wrong. Take 2 minutes to learn more
Arbitrum Price Prediction – October 21
The Arbitrum price prediction shows that ARB bounces off the support at $0.79 and pushes the coin toward the 21-day moving average.
ARB/USD Long-term Trend: Bearish (Daily Chart)
Key levels:
Resistance Levels: $1.00, $1.05, $1.10
Support Levels: $0.65, $0.60, $0.55
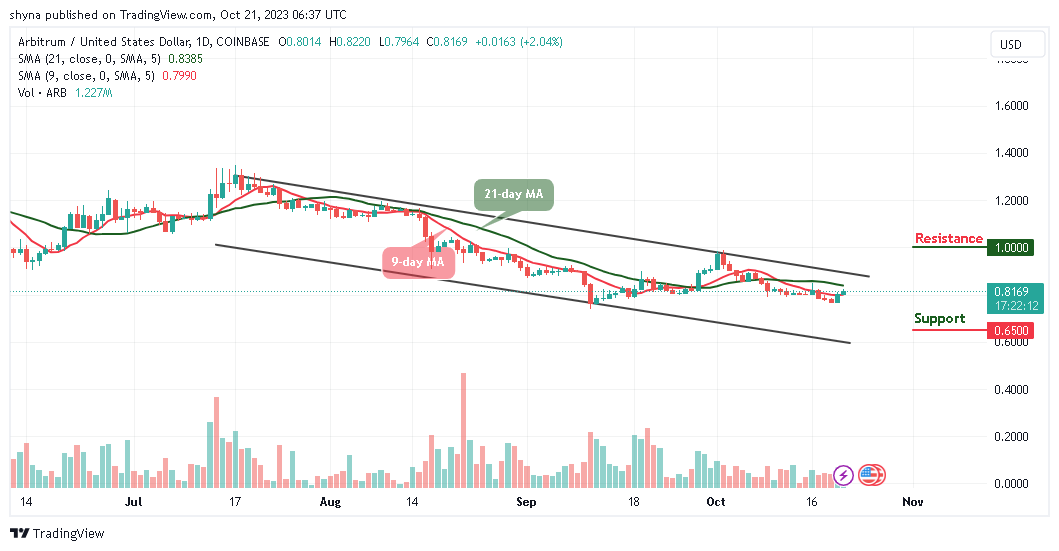
ARB/USD is currently trading around $0.81 with a 2.04% gain in the past 24 hours. According to the daily chart, the Arbitrum price is fighting to stay above the important level of $0.80 as it crosses above the 9-day moving average. However, for ARB/USD to remain above this level for the next few days, the bulls need to make the $0.79 support level to be pretty strong.
Arbitrum Price Prediction: Could Arbitrum (ARB) Break Higher?
Since yesterday, the Arbitrum price has begun to maintain a little upward movement, and if the coin breaks above the 21-day moving average, it could touch the nearest resistance level of $0.90. Moreover, Arbitron (ARB) needs to reclaim this important resistance level to head upwards. If successful, the cryptocurrency could therefore aim at a $0.95 resistance level.
However, looking at the daily chart, one may conclude that ARB/USD is done with the downside. Meanwhile, on the upside, recovery may not come easy and traders must be aware that support will have to be sorted above $0.90 while other important zones to keep in mind are around $1.00, $1.05, and $1.10 resistance levels.
Nevertheless, despite the current movement, the 9-day moving average is yet to cross above the 21-day moving average which means that there may still be a room that could be explored by the bears. If this happens, the supports at $0.65, $0.60, and $0.55 may play out.
ARB/USD Medium-term Trend: Bearish (4H Chart)
From a technical point of view, on the 4-hour chart, the 9-day moving average crosses above the 21-day moving average as the coin heads for the upward movement.
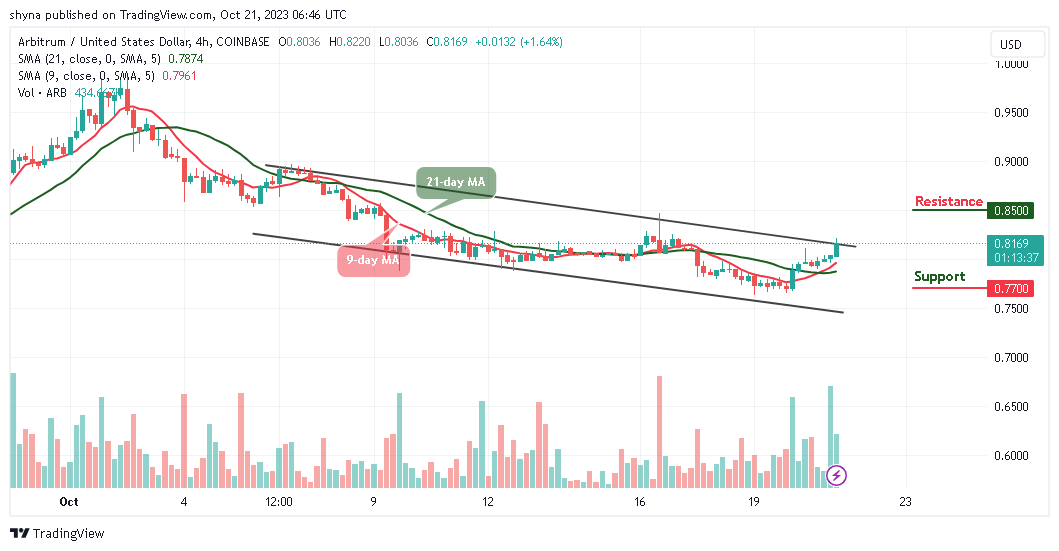
However, if the Arbitrum price breaks above the upper boundary of the channel, the market price may likely reach the resistance at $0.85 and above. On the contrary, if the current market value drops below the 9-day and 21-day moving averages, it may likely touch the support at $0.77 and below.
Place winning Arbitrum trades with us. Get ARB here