Polkadot (DOT) Breaks Resistance at $29, Resumes Uptrend
Estimated Reading Time: 2 minutes
Don’t invest unless you’re prepared to lose all the money you invest. This is a high-risk investment and you are unlikely to be protected if something goes wrong. Take 2 minutes to learn more
Polkadot (DOT) Long-Term Analysis: Bullish
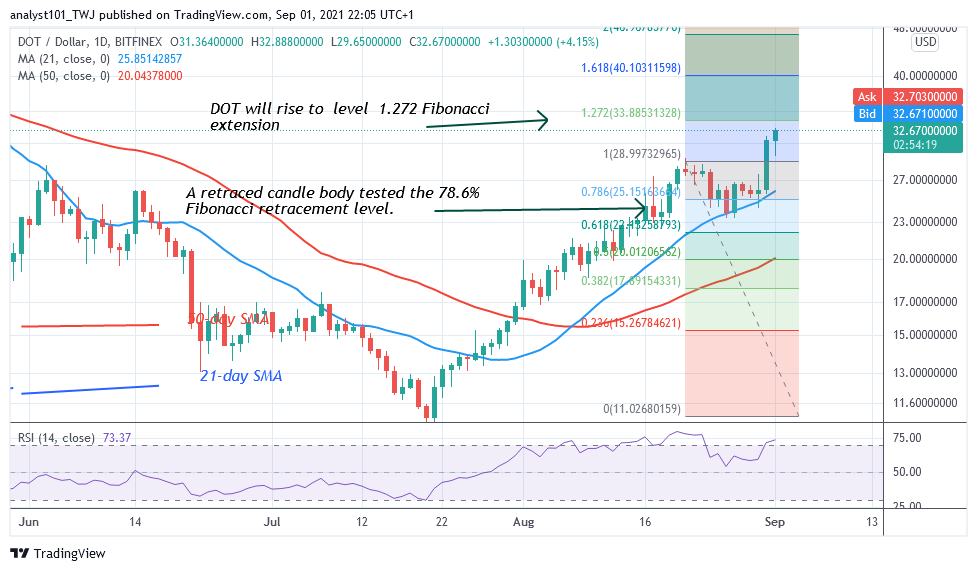
Today, the DOT price has broken above the $29 resistance as the market reaches the high of $32. The uptrend is likely to be short-lived as the altcoin reaches the overbought region. Meanwhile, on August 21 uptrend; a retraced candle body tested the 78.6% Fibonacci retracement level. The retracement indicates that the DOT price will rise but reverse to1.272 Fibonacci extension or level $33.88.
Polkadot (DOT) Indicator Analysis
DOT price is at level 73 of the Relative Strength Index period 14. It indicates that Polkadot is in the overbought region of the market. The 21-day and 50-day SMA are sloping upward indicating the uptrend. The altcoin is above the 80% range of the daily stochastic. The stochastic confirms that the market has reached the overbought region. Sellers will emerge in the overbought region of the market.
Technical indicators:
Major Resistance Levels – $48, $52, $56
Major Support Levels – $32, $28, $24
What Is the Next Direction for Polkadot (DOT)?
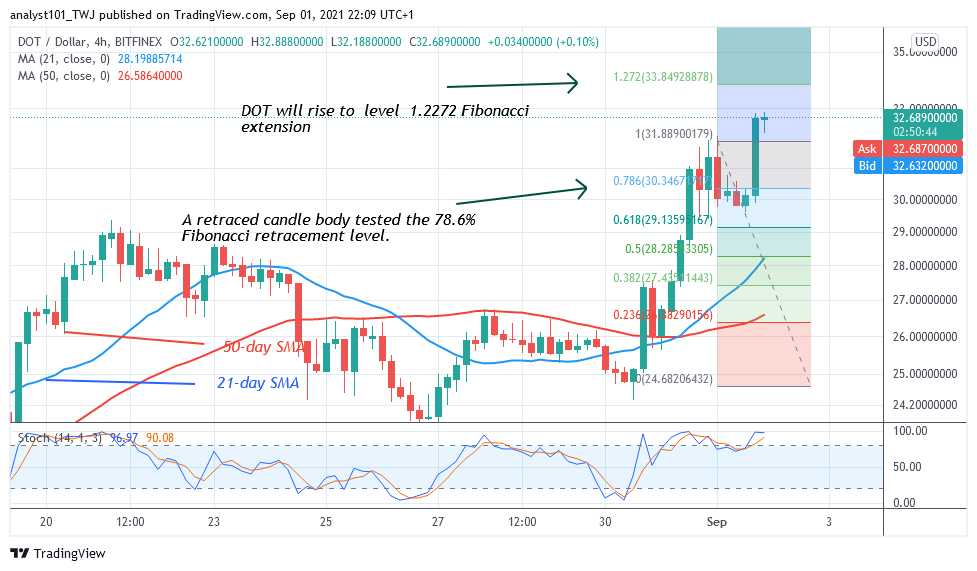
Polkadot’s price has resumed an uptrend has price breaks above the resistance level. Meanwhile, on September 1 uptrend; a retraced candle body tested the 78.6% Fibonacci retracement level. The retracement indicates that the DOT price will rise but reverse at level 1.272 Fibonacci extension or level $33.84.
You can purchase crypto coins here. Buy Tokens
Note: Cryptosignals.org is not a financial advisor. Do your research before investing your funds in any financial asset or presented product or event. We are not responsible for your investing results