



Bitcoin Cash (BCH/USD) Price Keeps Trading in Ranges
Estimated Reading Time: 3 minutes
Don’t invest unless you’re prepared to lose all the money you invest. This is a high-risk investment and you are unlikely to be protected if something goes wrong. Take 2 minutes to learn more
Bitcoin Cash Price Prediction – November 13
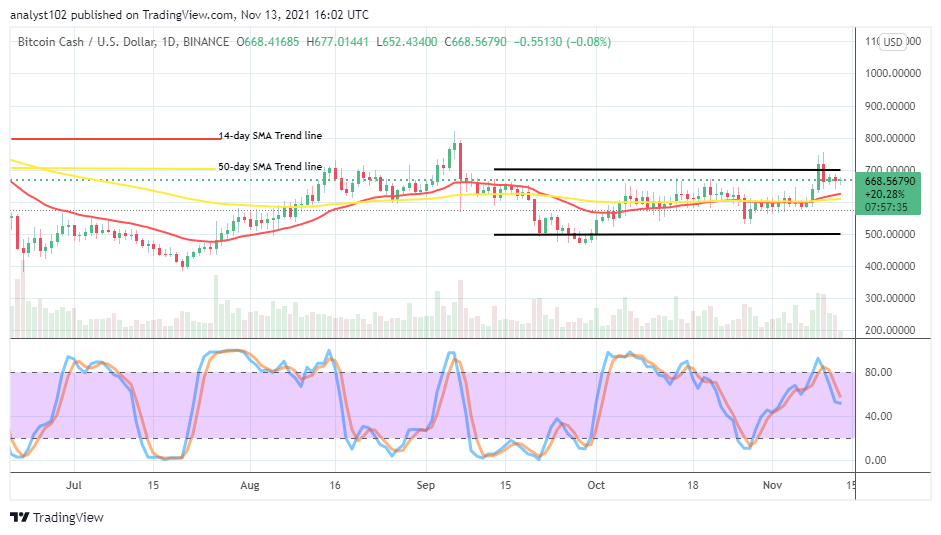
It still appears that the BCH/USD price activity keeps trading in ranges characterized by $700 and $500 lines over several sessions until now. Currently, the crypto-economic market prices at a relatively small percentage rate of about 0.08, trading around $668 as of writing.
BCH/USD Market
Key Levels:
Resistance levels: $700, $800, $900
Support levels: $500, $400, $300
BCH/USD – Daily Chart
The BCH/USD daily chart reveals that the crypto-economic price keeps trading, in ranges of $700 and $500 levels. In November the 9th session, the market surged briefly higher past the upper range level. But, on the following day, 10th, the movement reversed back to trade closely around the upper range value-line until the present. The 14-day SMA indicator has crossed the 50-day SMA indicator to the north within the specified range-bound zones. The BCH/USD daily chart reveals that the crypto-economic price keeps trading, in ranges of $700 and $500 levels. In November the 9th session, the market surged briefly higher past the upper range level. But, on the following day, 10th, the movement reversed back to trade closely around the upper range value-line until the present. The 14-day SMA indicator has crossed the 50-day SMA indicator to the north within the specified range-bound zones.
What should be traders’ trading approach as the BCH/USD price keeps trading in ranges?
It established that the BCH/USD market operations have not yet pushed much northward away from trading in range-bound zones. Currently, the crypto-economic price keeps trading in the ranges of $700 and $500 as the market is around the upper-value line. If the range-bound trading approach would still have to be valid, then bulls shouldn’t survive breaking out at that level of trading afterward. The lower or zones between $600 and 4500 necessary that bulls should get re-settled to garner energies.
On the downside, the BCH/USD market bears may now steak to a range-bound trading approach as the crypto-economic price keeps ranging around the upper range value line at $700. There is a need that some rejections come up around that trading value line that is eventually coupling with a significant bearish candlestick to confirm a return of a down motion subsequently.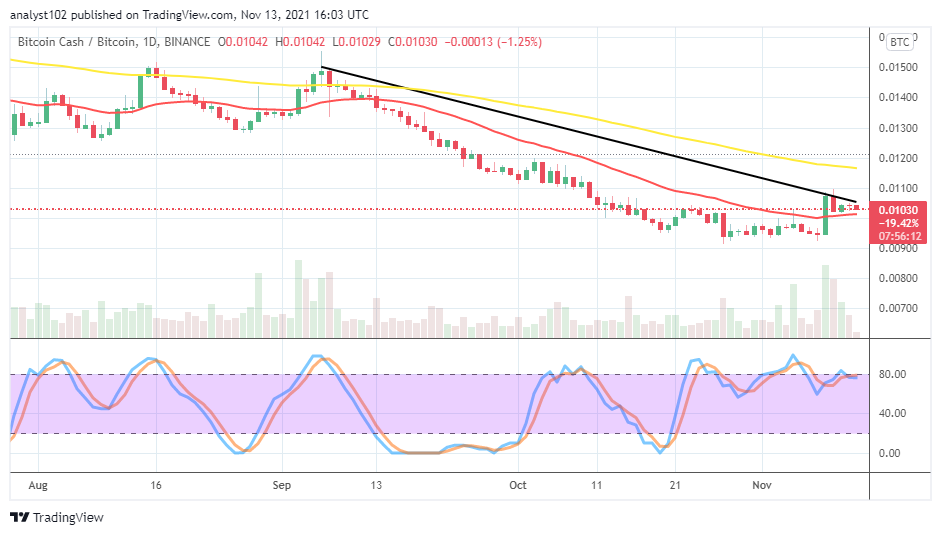
BCH/BTC Price Analysis
In comparison, the trending ability of Bitcoin Cash as looked against Bitcoin seems to now struggle for a recovery motion. The cryptocurrency pair price keeps trading in ranges, around the smaller SMA trend line beneath the bigger SMA trend line. The Stochastic oscillators are around the range of 80, moving in a consolidation manner. That suggests that the base crypto is on the threshold of striving against the flagship counter crypto. A bullish candlestick that emerged during the 9th trading operation seems to have
Note: Cryptosignals.org is not a financial advisor. Do your research before investing your funds in any financial asset or presented product or event. We are not responsible for your investing results.
You can purchase crypto coins here. Buy Tokens



