Chainlink (LINK/USD) Emerges from a Prolonged Sideway Market, Targeting Elevated Price Levels
Estimated Reading Time: 3 minutes
Don’t invest unless you’re prepared to lose all the money you invest. This is a high-risk investment and you are unlikely to be protected if something goes wrong. Take 2 minutes to learn more
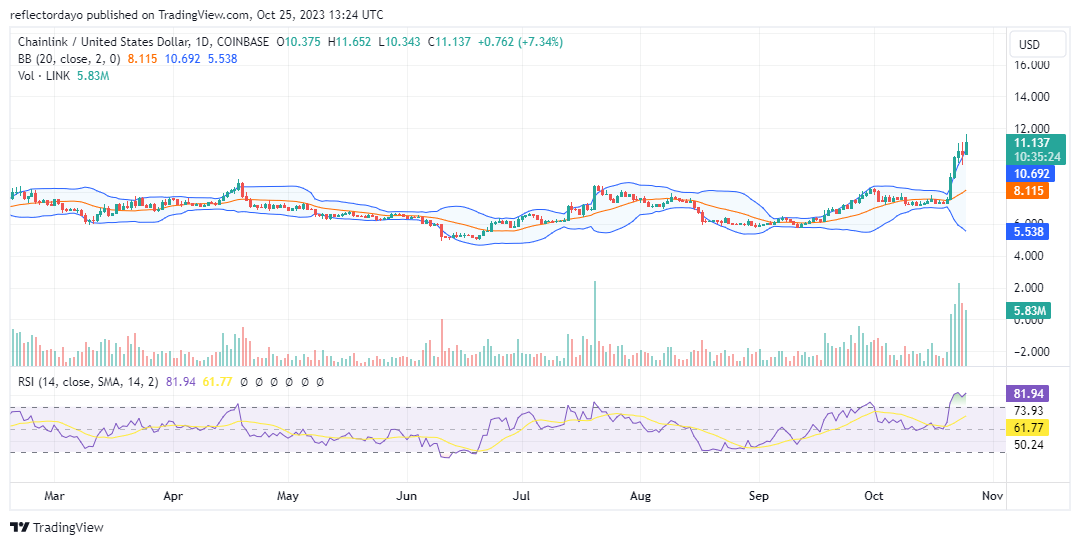
From a broader time frame analysis of the Chainlink market, it appears to have been trading in a sideways range since January. The price has consistently oscillated within the range of $5.00 and $8.00, with occasional brief attempts to breach the $8.00 level since the year’s outset. However, in the latter part of October, the Chainlink market exhibited a significant shift towards a bullish trend, characterized by heightened liquidity and explosive upward momentum in the bull market.
Chainlink Market Data
- LINK/USD Price Now: $11.111
- LINK/USD Market Cap: $6,133,904,008
- LINK/USD Circulating Supply: 556,849,970 LINK
- LINK/USD Total Supply: 1,000,000,000 LINK
- LINK/USD CoinMarketCap Ranking: #12
Key Levels
- Resistance: $12.00, $13.00, and $14.00.
- Support: $8.00, $7.00, and $6.50.
Chainlink Price Forecast: Analyzing the Indicators
The Chainlink bull market experienced a surge in liquidity on October 21st, coinciding with its breakthrough of the long-term $8.00 resistance level. This successful breach of longstanding resistance has bolstered trader confidence, instigating a growing bullish sentiment. It has also prompted concerns about FOMO (fear of missing out) among traders. With the market’s ascent following the resistance break, traders who had previously remained on the sidelines may now fear missing out on potential gains, resulting in increased buying activity.
While there are clear indications of robust bullish interest in the market, there are also concerns that such a strong bullish rally could trigger substantial profit-taking, potentially reverting the market to its previous horizontal price channel. Traders are advised to proceed with caution, recognizing that while the breakthrough of the long-term resistance marks a significant development, it may be the initial phase of a broader bullish trend.
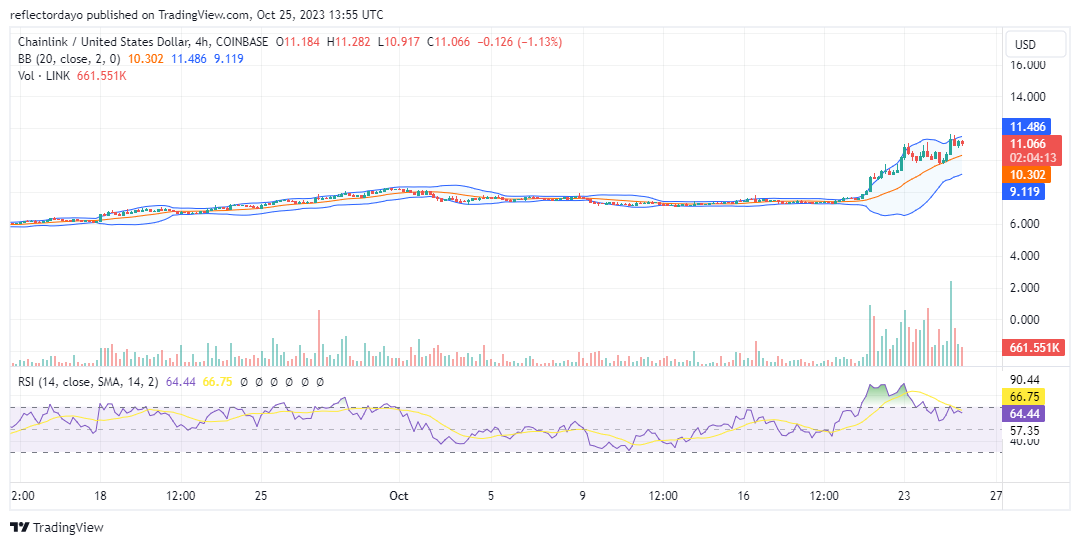
LINK/USD 4-Hour Chart Outlook
Around the $12.00 price level, the bull market appears to be approaching a significant ‘sell’ zone, which is causing a slowdown in the bullish trend due to the encounter with resistance at this juncture. Nevertheless, it is evident that the bulls maintain control, considering the establishment of a support level above $10.00 and another support level near the $11.00 price point. The emergence of these higher support levels is poised to exert pressure on the resistance area, potentially ensuring the continuation of the bullish trend.