Bitcoin Cash (BCH/USD) Price Draws down to a $300
Estimated Reading Time: 3 minutes
Don’t invest unless you’re prepared to lose all the money you invest. This is a high-risk investment and you are unlikely to be protected if something goes wrong. Take 2 minutes to learn more

Free Crypto Signals Channel
Bitcoin Cash Price Prediction – April 29
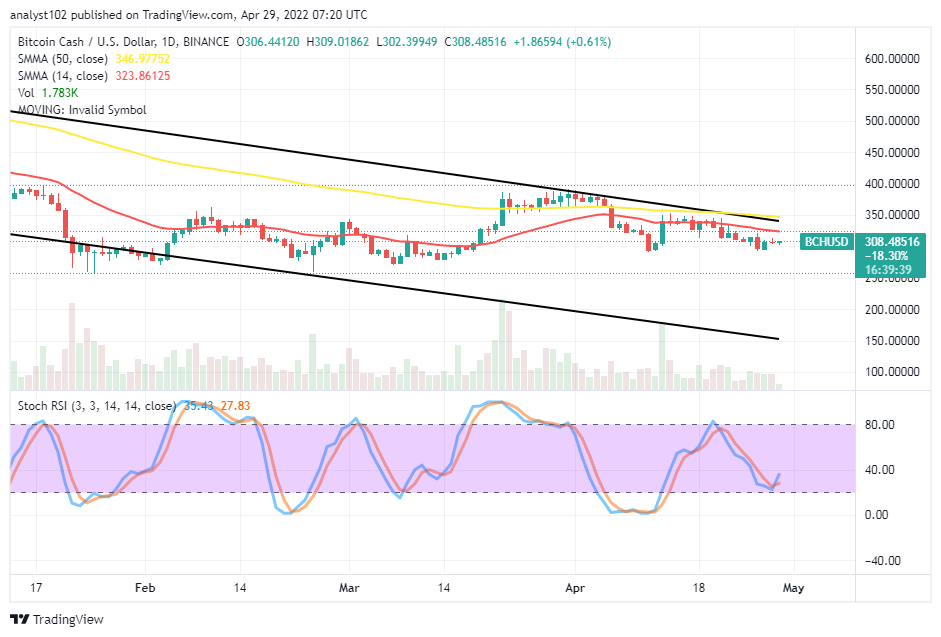
At last, the BCH/USD market price draws down to around the $300 trading line after a gradual lowering-moving mode. The crypto economy, as of writing, trades values between $309 and $302 at a minimal positive percentage rate of 0.61.
BCH/USD Market
Key Levels:
Resistance levels: $3500, $400, $450
Support levels: $300, $250, $200
BCH/USD – Daily Chart
The BCH/USD daily chart reveals the crypto-economic market price draws down to a $300 support level following a lesser-active downing process in the market activities. The SMA trend lines are closely beneath the upper bearish channel trend line. The 14-day SMA indicator is underneath the 50-day SMA indicator, seemingly bending southward. The Stochastic Oscillators have traveled southbound to the range of 20. And they have slightly crossed their lines briefly to the north direction to indicate that a buying force is somewhat on course.
Should it be considered now that the BCH/USD trade will soon swing upward as the crypto-economic price draws down to $300?
A little fair consideration can be to the expectation of seeing the BCH/USD market operations swinging upward soon as the crypto-economic price draws down to a $300 support level. Presently, the technical trading approach outlook suggests bulls should have the strength to make a rebound in no time from around the value line. In the wake of anything short of that, the crypto economy may run being range-bound with fewer motions playing along.
On the downside of the technical analysis, the BCH/USD market sellers should be wary of exerting new sell orders at this point to avoid unnecessary whipsaw by bears. A better and decent selling moment will surface after the market can spring upward past the SMAs to find resistance above them in the long-term run before duly considering a selling order. Therefore, sellers may have to keep off the trade for a while.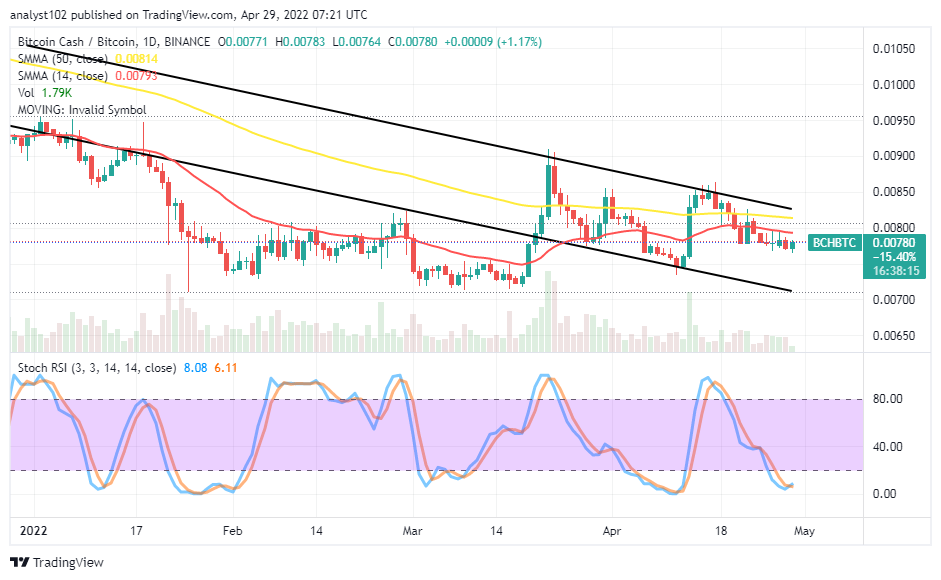
BCH/BTC Price Analysis
Bitcoin Cash is confined to a lower-trading spot, pairing with Bitcoin. The cryptocurrency pair market price draws down closely beneath the sell signal side of the SMAs. The 14-day SMA trading indicator is underneath the 50-day SMA indicator. The Stochastic Oscillators are in the oversold region, trying to cross back their lines northbound at a near point over the range of zero. A smaller bullish candlestick is in the making, signifying the base crypto is struggling to make a come-back against its countering crypto in the near term.
Note: Cryptosignals.org is not a financial advisor. Do your research before investing your funds in any financial asset or presented product or event. We are not responsible for your investing results.
You can purchase Lucky Block here. Buy LBlock: