POL (prev. MATIC) Price Prediction: POL/USDT Sees Moderate Recovery
Estimated Reading Time: 3 minutes
Don’t invest unless you’re prepared to lose all the money you invest. This is a high-risk investment and you are unlikely to be protected if something goes wrong. Take 2 minutes to learn more

Date: November 8, 2025
The POL (previously MATIC) market appears to be staging a moderate recovery from its recent steep decline below the lowest price level seen since June. Moreover, the ongoing session shows that the upward movement is continuing, even above key technical levels.
POL/USDT Long-Term Trend — Bullish (Daily Chart)
Key Price Levels:
Resistance: $0.1900, $0.2100, $0.2300
Support: $0.1800, $0.1700, $0.1500
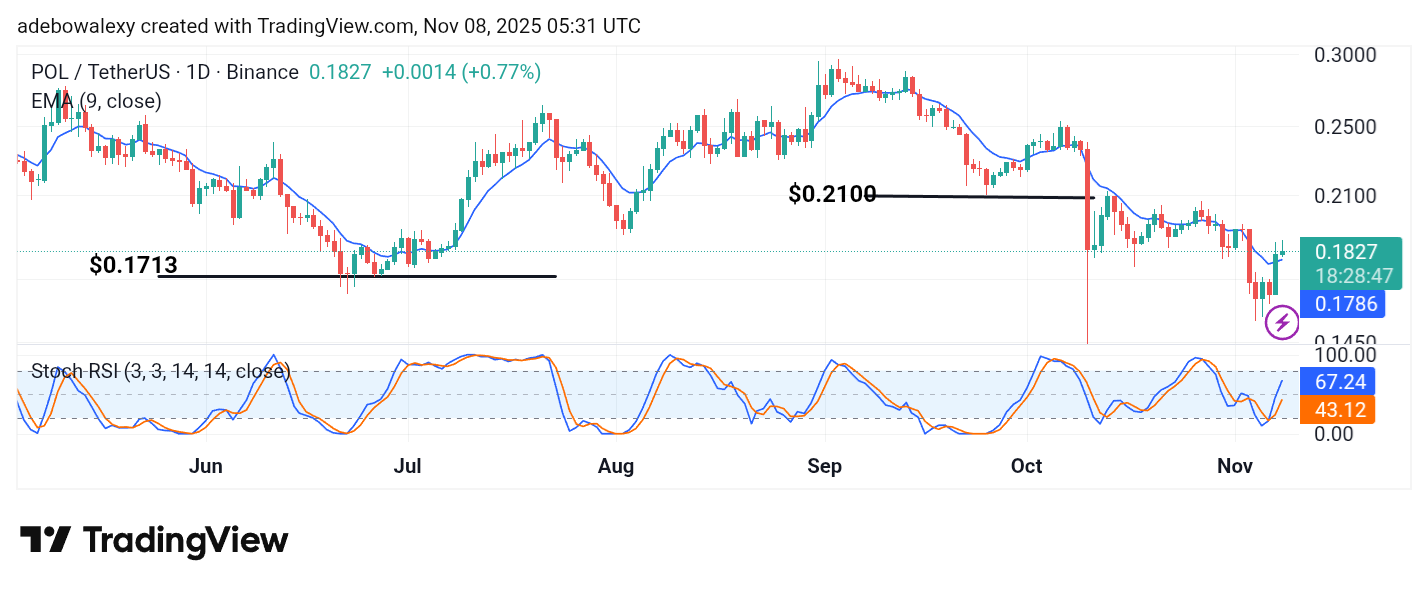
The POL (prev. MATIC) market began its upward retracement in the previous session. The bullish movement was quite strong and pushed the price above the 9-day Exponential Moving Average (EMA) curve. The ongoing session has maintained this path but has recorded some bearish contractions.
Nevertheless, the Stochastic Relative Strength Index (SRSI) indicator lines have continued their upward trajectory following the latest bullish crossover in the oversold region.
POL/USDT Price Prediction: POL (prev. MATIC) Holding at Key Levels
Despite the mild contraction seen in the ongoing session on the POL (prev. MATIC) daily chart, price action has maintained its upward trajectory. The appearance of the latest price candle suggests a continuation of the general bullish trend.
Additionally, market activity remains above the 9-day EMA curve. The fact that the price has sustained its bullish structure above this critical level, despite recent pullbacks, provides confidence for bullish traders.
Similarly, the SRSI has risen sharply. Although slightly affected by the contraction, it continues to maintain a bullish bias.
POL/USDT Price Prediction: POL (prev. MATIC) Faces Rejection Above the 9-Day EMA (4-Hour Chart)
The latest price candle on the 4-hour chart for POL (prev. MATIC) is bearish, showing a slight deviation from the previous strong bullish trajectory. It has appeared in the form of an inverted hammer positioned above the 9-day EMA curve.
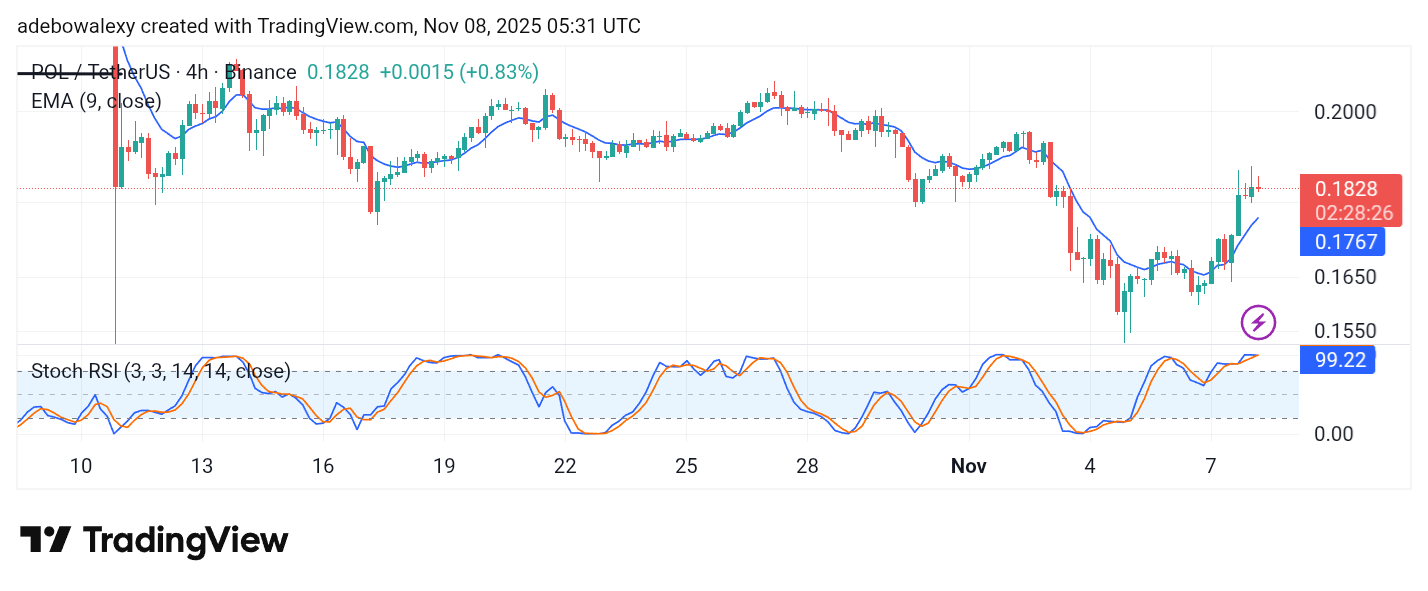
The SRSI indicator lines are seen converging in the overbought region, with their terminal ends moving sideways near the 100 mark.
Consequently, this suggests that the market may retrace toward lower price levels, such as $0.1809, before attempting another upward move toward the $0.1900 resistance zone.
Get POL (prev. MATIC) here. Buy POL