Low Volatility May Cause 0x (ZRXUSD) To Subside
Estimated Reading Time: 3 minutes
Don’t invest unless you’re prepared to lose all the money you invest. This is a high-risk investment and you are unlikely to be protected if something goes wrong. Take 2 minutes to learn more
0x Price Analysis – the Market May Subside Due to the Current Low Volatility
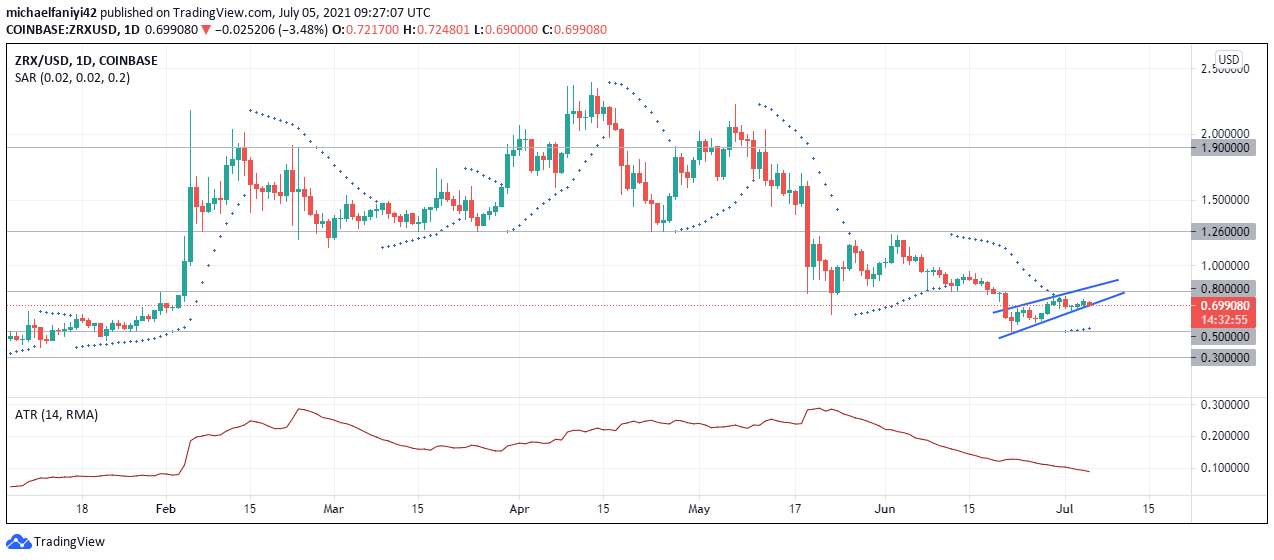
0x (ZRXUSD) low volatility may plunge the market from its ascending channel. On the 3rd of February 2021, a drastic increase in market volatility created a surge in ZRX. The price rose and moved past the $0.8000 and $1.2600 key levels with ease, till it got to a height of around $2.2000. Though the price immediately fell back to $1.2600, the volatility remained on the rise. 0x began moving in a drastic undulating manner with that increase in volatility.
By the 21st of February 2021, the volatility strength took a plunge. Coming with it are less drastic market moves. The low volatility continued till the 29th of March 2021, when it was jacked up once again. The bulls immediately capitalized on the increased volatility to move the market up once again. The coin was once again lifted above the $1.9000 key level till it got to the year’s high at around $2.4000.
The bears also employed the increasing volatility strength to plunge the market harder, in which the market dived directly from the year high to $1.2600 support. Still, with increasing volatility, another flight upwards began immediately to the $2.2000 key level, which was again followed by a much more volatile market dip to the $0.8000 key level. The bulls were about to strike again when the market volatility itself took a plunge, and so the bulls were not able to lift 0x back to the height where it fell from.
The market began undulating between $0.8000 support and $1.2600 resistance. This continued till the 20th of June 2021 when the price then fell lower to $0.5000 support. In all these, the market has remained in a steady and continuous volatility decline. From $0.5000, the market has now made an effort to rise again. It is currently rising towards the $0.8000 resistance. It remains to be seen if, with the ever-decreasing volatility as shown by the ATR (Average True Range), the market will make it past the $0.8000 resistance. The Parabolic SAR (Stop and Reverse) however shows a strong market move upwards with five dots below the daily candles.
0x Key Levels
Resistance: $1.9000, $1.2600, $0.8000
Support: $0.5000, $0.3000
Market Prospects
The ascending channel’s lower border has been very strong in acting as support for 0x. The price is bouncing up from the lower border again.
The volatility is still diving at 0.2289 on the ATR. The Parabolic SAR is reflecting the pullback in the price to find support at the border channel. The continuous decrease in volatility will likely prevent 0x from breaking past $0.8000 and the market will likely break below the channel to fall back to $0.5000.
You can purchase crypto coins here. Buy Tokens
Note: Cryptosignal.org is not a financial advisor. Do your research before investing your funds in any financial asset or presented product or event. We are not responsible for your investing results.