Polkadot (DOT) Reaches Bearish Exhaustion, Resumes Uptrend
Estimated Reading Time: 2 minutes
Don’t invest unless you’re prepared to lose all the money you invest. This is a high-risk investment and you are unlikely to be protected if something goes wrong. Take 2 minutes to learn more
Polkadot (DOT) Long-Term Analysis: Bullish
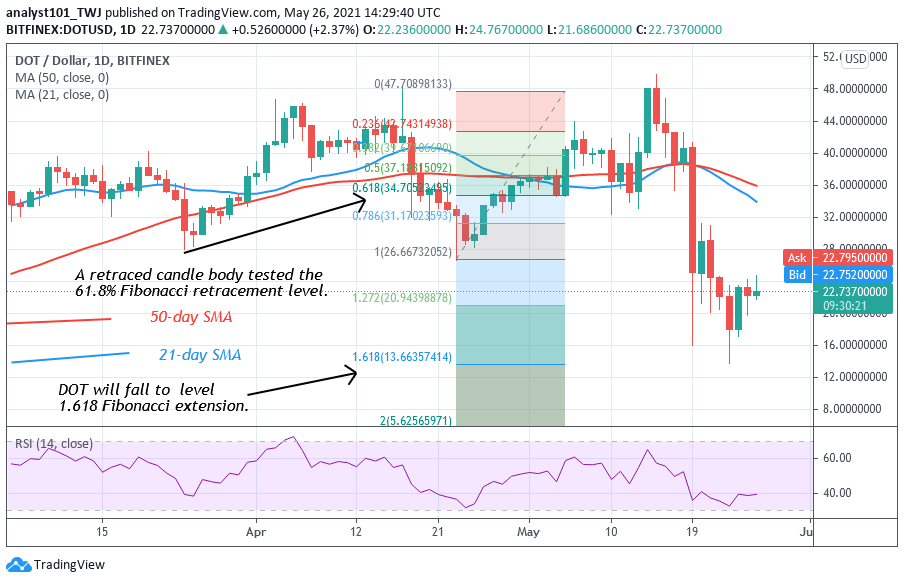
Polkadot (DOT) has been in a downward move since May 15. The altcoin has reached bearish exhaustion as it fell to $13 low and pulled back. In the first bearish impulse, the market declined to $16 low. The bulls bought the dips and price corrected upward to $32 high. The upward correction was terminated as price resumed fluctuation between $16 and $32. Meanwhile, on April 23 downtrend; a retraced candle body tested the 61.8% Fibonacci retracement level. This indicates that DOT price will decline to level 1.618 Fibonacci extension or level $13.66. From the price action, DOT price has tested the 1.618 Fibonacci extension and move up.
Polkadot (DOT) Indicator Analysis
DOT price has fallen to level 39 of the Relative Strength Index period 14. It indicates that the market is in the downtrend zone and approaching the oversold region. The 21-day and 50-day SMAs are sloping horizontally.

Technical indicators:
Major Resistance Levels – $48, $52, $56
Major Support Levels – $32, $28, $24
What Is the Next Direction for Polkadot (DOT)?
DOT price has reached the oversold region as buyers emerged.
On the 4 hour chart, the market is making an upward move. On May 25 uptrend; a retraced candle body tested the 61.8% Fibonacci retracement level. The retracement indicates that the DOT price will rise to level 1.618 Fibonacci extension or the high of $30.66.

Note: new.cryptosignals.org is not a financial advisor. Do your research before investing your funds in any financial asset or presented product or event. We are not responsible for your investing results