UMA (UMAUSD) Is Gradually Sinking Despite Support From $10.300
Estimated Reading Time: 3 minutes
Don’t invest unless you’re prepared to lose all the money you invest. This is a high-risk investment and you are unlikely to be protected if something goes wrong. Take 2 minutes to learn more

Market Analysis – As Bears Put Pressure on $10.300, UMA Is Gradually Sinking
UMA is gradually sinking as much pressure is being put on the $10.300 support. When price dropped precipitously on the 7th of September, price sank below the $10.300 key level, but it quickly recovered above it. The coin has found serious difficulty in climbing any higher, with $11.200 proving difficult. UMA is now succumbing to the opposition and gradually sinking, and putting pressure on $10.300.
UMA Important Levels
Resistance Levels: $11.200, $12.800, $14.700
Support Levels: $10.300, $9.000, $7.200
A slip at the $14.700 resistance level plummeted UMA in a day and undid several days of laborious climbing by the coin. The previous contact between the coin and $14.700 came on the 21st of August 2021, after which the price was knocked down sharply, but found support at $12.800. Days of a triangular tapering movement followed, which led to the upside breakout of the coin. This move pumped the coin back up to $14.700.
The $14.700 key level remained resilient, however, and a far greater knock was dealt to the market, which sank it by about 37%. This also knocked out what bullish momentum the market had previously, and therefore, control has now been gifted to the sellers. A gradual sinking of the coin can be noticed on the RSI (Relative Strength Index) chart as its signal line takes a gentle plunge. The Stochastic Oscillator, on the other hand, shows several crosses just above the oversold border. This shows indecision, but the initiative still lies with the bears.

Market Prospects
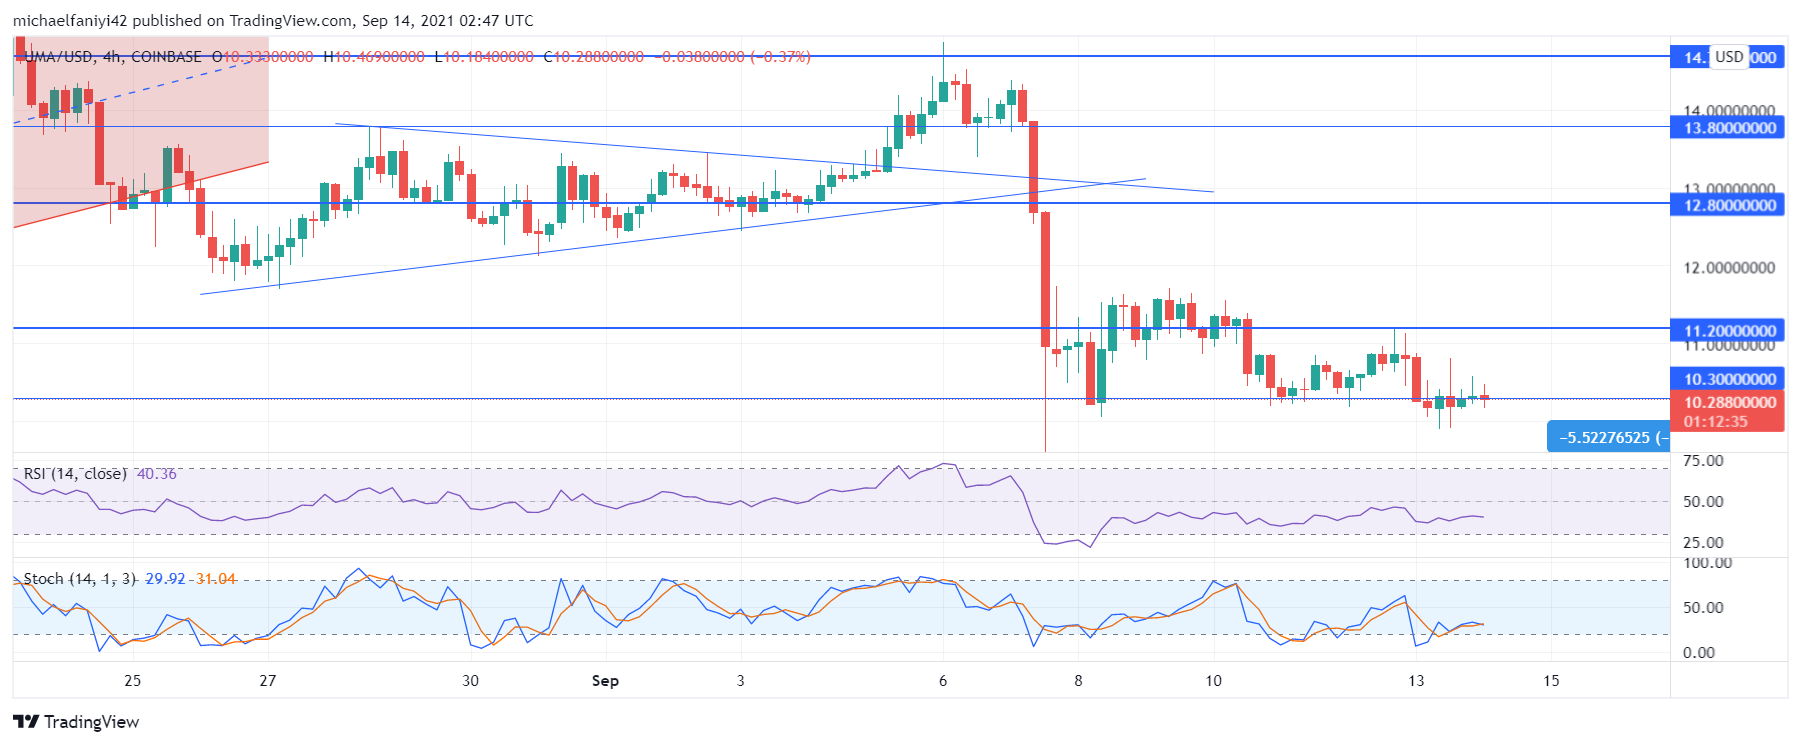
The price is currently ranging between the key levels of $11.200 and $10.300.There could be a further sinking of the coin out of the range zone anytime soon as the 4-hour candles can be seen leaning heavily on the $10.300 support at the moment. This is because the market is being subjected to much bearish pressure. Both the RSI and the Stochastic Oscillator show parallel movement, but there is now a cross on the Stochastic Oscillator which will be a hint of an imminent sinking of the market. If this happens, the price could drop as low as $8.200.
You can purchase crypto coins here: Buy Tokens
Note: Cryptosignals.org is not a financial advisor. Do your research before investing your funds in any financial asset or presented product or event. We are not responsible for your investing results.