Chainlink ETFs Are Moving Again After Weeks of Inactivity
Estimated Reading Time: 4 minutes
Don’t invest unless you’re prepared to lose all the money you invest. This is a high-risk investment and you are unlikely to be protected if something goes wrong. Take 2 minutes to learn more

Key Takeaways:
- Chainlink ETFs ended a two-week inflow drought with fresh demand.
- Whale accumulation and CCIP adoption continue to support LINK.
- Price remains volatile despite renewed institutional interest.
Spot ETFs don’t move markets the way whale wallets do, but their flows are one of the cleanest signals of steady institutional interest — precisely because they only move when real capital decides to show up. LINK’s ETF complex just broke a stretch of silence, and the timing is worth a closer look.
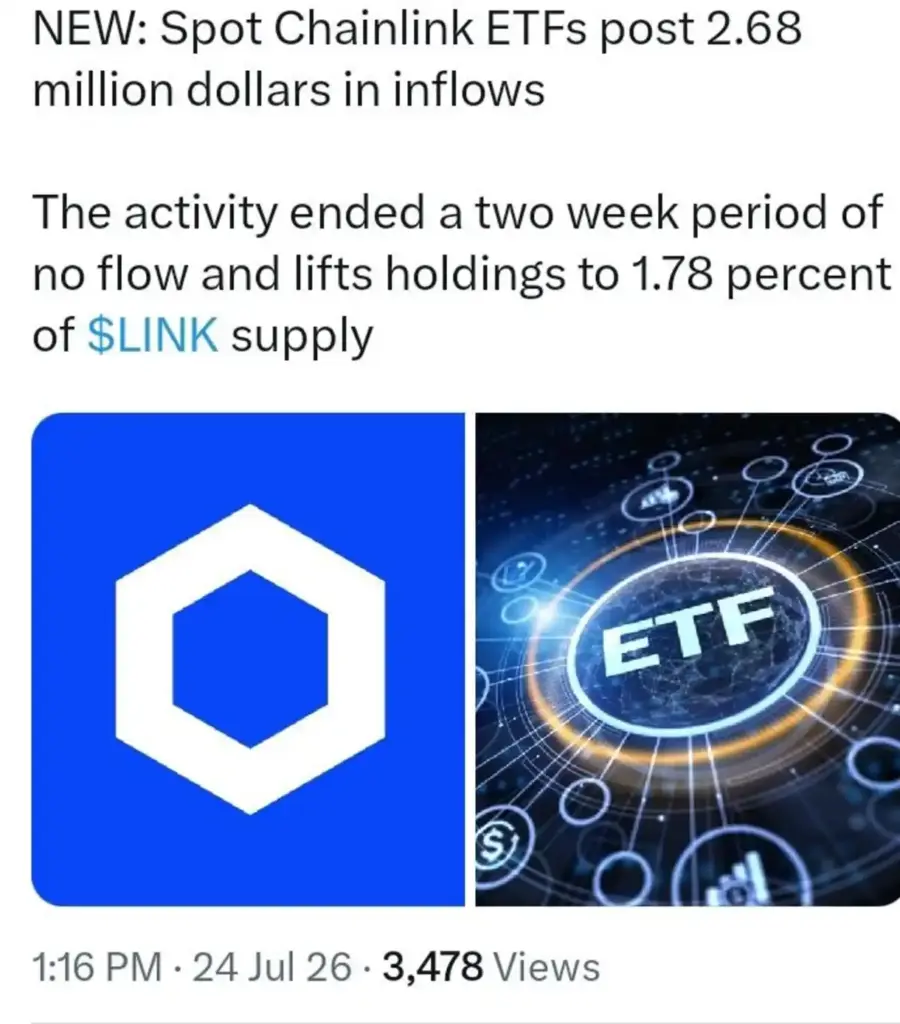
Spot Chainlink ETFs posted $2.68 million in inflows, ending a two-week period of no flow and lifting holdings to 1.78% of LINK supply. LINK trades at $8.32, up 1.2% over the past seven days, according to CoinGecko.
A Flow History With More Texture Than It Looks
The $2.68 million inflow landed on July 22, lifting cumulative net inflows to $127.83 million, according to SoSoValue data. That figure builds on a run that’s been anything but a straight line. LINK’s ETF complex had strung together 203 consecutive days without a net outflow before that streak broke in June, when the complex posted its first negative day, a roughly $490,920 outflow that pulled cumulative inflows down from about $123.82 million to $123.33 million. Since then, flows have alternated between small inflows and quiet stretches — including a standout $915,200 weekly inflow during the week of July 2 — before this latest two-week pause ended on July 22.
What’s Been Building Alongside the Flows
The inflow arrived alongside continued institutional integration work, with Mantle migrating its $2.5 billion Super Portal to Chainlink’s CCIP and Aave selecting Chainlink infrastructure for automated vault rebalancing. The number of Ethereum wallets holding LINK has also passed 900,000, pointing to broadening on-chain adoption running in parallel with the ETF activity. Santiment data has also flagged whale accumulation of roughly 14 million LINK, adding another layer of demand alongside the regulated fund flows.
The Chart Tells a More Volatile Story Than the Flows Do
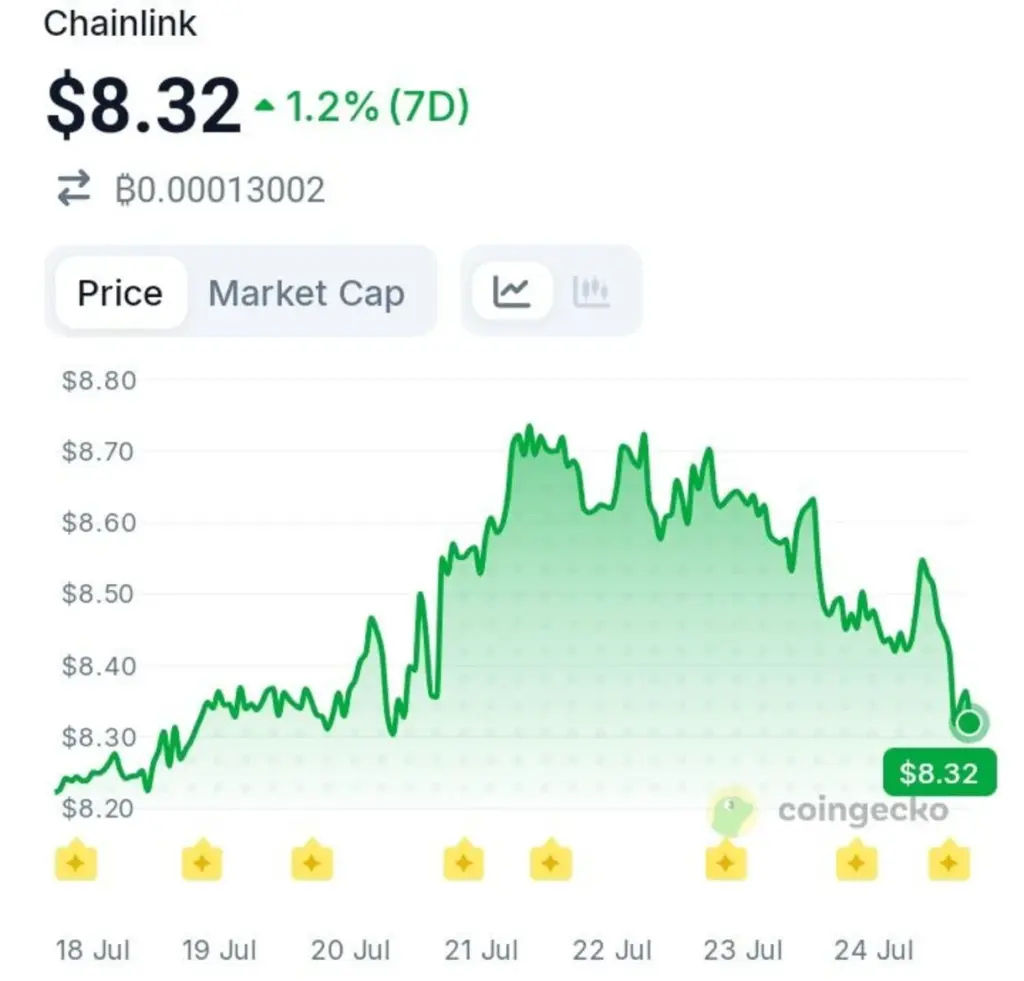
Looking at the seven-day chart, LINK climbed steadily from around $8.20 on July 18 to a peak near $8.72 on July 21, riding the momentum that preceded this ETF activity. From there, price reversed hard, sliding through July 22 and 23 before a sharp drop into July 24 pulled LINK back down to $8.32 — essentially erasing most of the week’s gains in a single session. That drop happened on the same day the ETF inflow was reported, a reminder that even positive institutional flow data doesn’t always translate into immediate price support.
Why the Signal Still Matters
A single $2.68 million inflow isn’t large enough to reverse a trend on its own. But ending a two-week dry spell, combined with continued CCIP adoption and whale accumulation running in the background, suggests institutional interest in LINK hasn’t disappeared even as short-term price action has turned choppy. Whether that steady undercurrent eventually shows up in the chart the way it did in early July, or gets overwhelmed by broader market pressure, is the question this data leaves open for now.