Hedera Hashgraph (HBAR/USD) Price Correction: Bulls Aim to Rally at $0.12
Estimated Reading Time: 3 minutes
Don’t invest unless you’re prepared to lose all the money you invest. This is a high-risk investment and you are unlikely to be protected if something goes wrong. Take 2 minutes to learn more
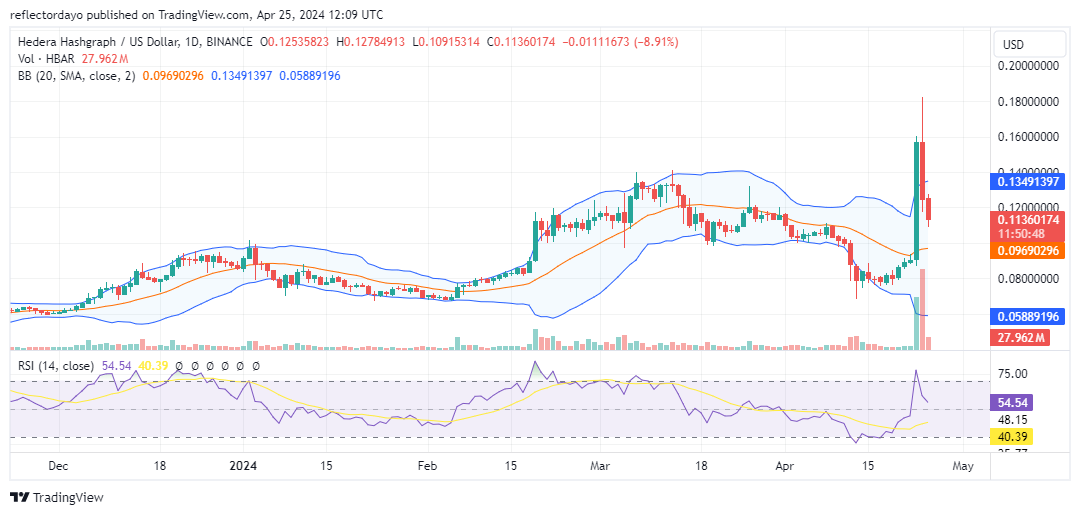
In yesterday’s market, we observed a significant surge in bullish momentum that propelled the price of Hedera Hashgraph to an impressive height of $0.18, marking a substantial increase from its previous level around $0.097 before undergoing a correction. Initially, this bullish movement was substantial and characterized by heightened activity. However, such pronounced market movements often trigger equally strong bearish responses as traders seek to capitalize on profit-taking opportunities.
During yesterday’s analysis of Hedera Hashgraph, it was noted that bulls were likely to intervene around the $0.12 price level, aiming to establish a pivotal support zone to sustain the bullish stance at a considerably higher level than before. Nevertheless, the bullish camp encountered significant selling pressure, resulting in the market slipping slightly below the $0.12 mark.
Hedera Hashgraph Market Data
- HBAR/USD Price Now: $0.114
- HBAR/USD Market Cap: $4 billion
- HBAR/USD Circulating Supply: 35.7 billion
- HBAR/USD Total Supply: 50 billion
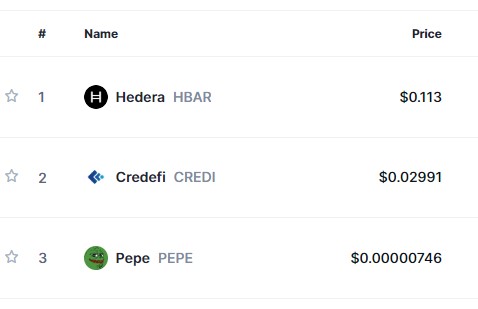
- HBAR/USD CoinMarketCap Ranking: #25
Key Levels
- Resistance: $0.16, $0.17, and $0.18.
- Support: $0.10, $0.09, and $0.08.
Hedera Hashgraph Through the Lens of Indicators
As the market approaches the $0.12 price threshold, analysis of yesterday’s daily trading session reveals a notable bounce, indicated by the lower shadow on the candlestick chart. Today’s bearish candlesticks also exhibit lower shadows, signaling the presence of bullish activity around this critical price level. Despite the apparent strength of bearish pressure, stemming from increased volatility sparked by previous bullish sessions, the crypto signals are currently indicating stabilization as bulls appear to be stepping in at $0.12.
Both the Bollinger Bands indicator and the Relative Strength Index (RSI) depict the current market dynamics as a corrective phase following overbought conditions. Additionally, the volume of trade indicator shows a sharp decline in the height of the histogram, suggesting a potential consolidation phase near the $0.12 price level.
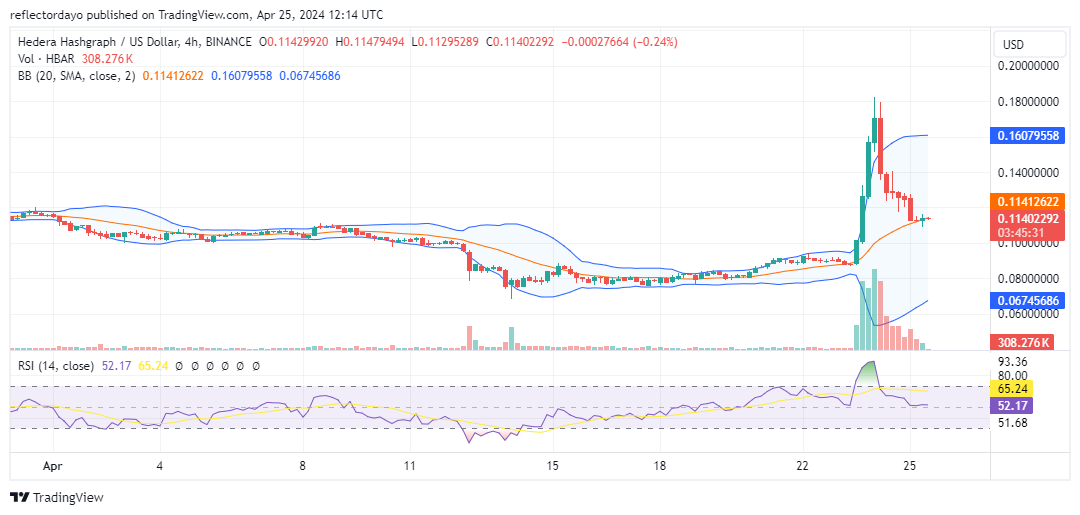
HBAR/USD Price Prediction: 4-Hour Chart Analysis
From a shorter-term perspective, focusing on the 4-hour chart timeframe for Hedera Hashgraph, we observe a pronounced consolidation phase, particularly evident around the $0.114 price point. Supply and demand appear to have reached equilibrium at this level, suggesting a potential stalling of further price fluctuations. The current price of $0.114 may be regarded as the prevailing equilibrium level within the market. Following this period of consolidation, there is a possibility of witnessing a notable directional movement in the market in the near future.