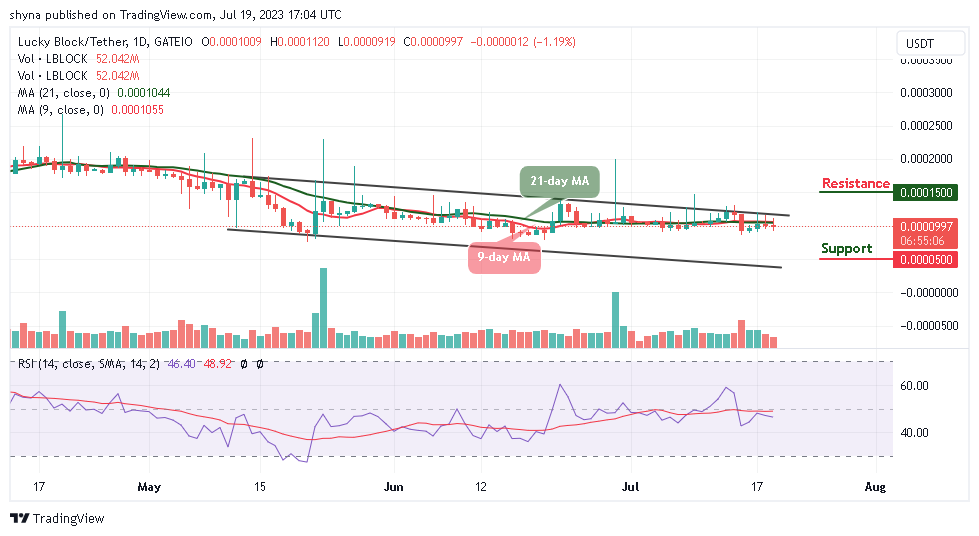
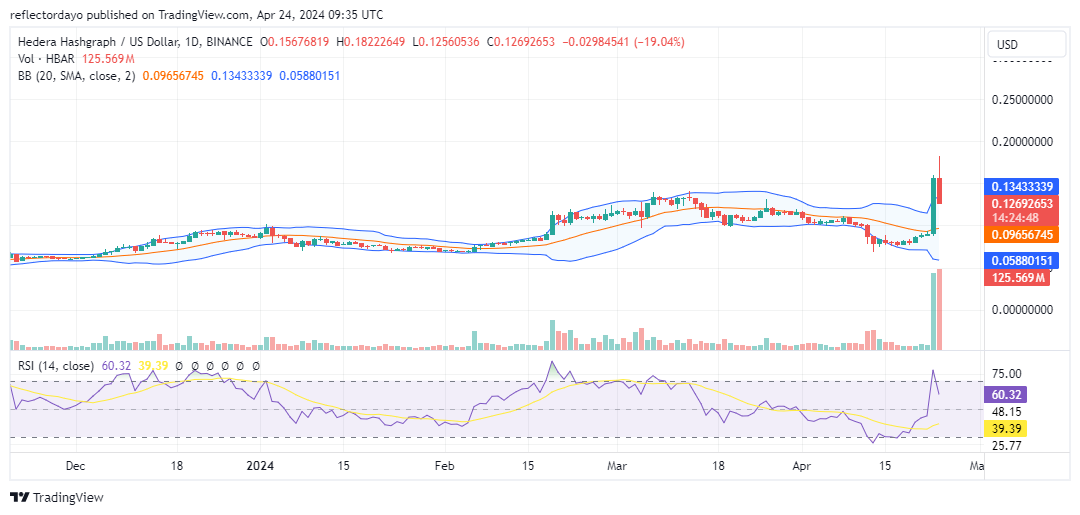
Hedera Hashgraph (HBAR/USD) Corrects After Strong Price Surge
Estimated Reading Time: 3 minutes
Don’t invest unless you’re prepared to lose all the money you invest. This is a high-risk investment and you are unlikely to be protected if something goes wrong. Take 2 minutes to learn more
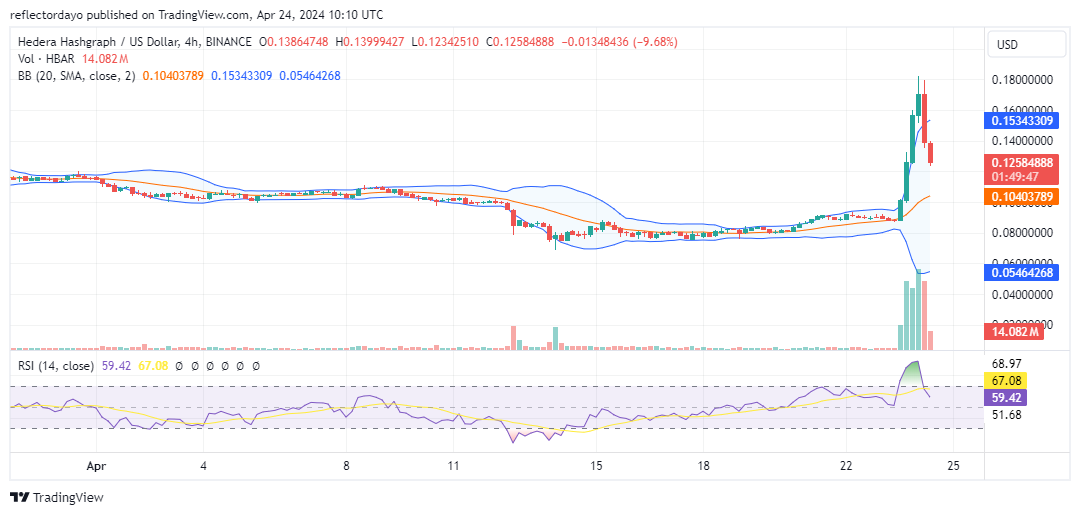
The Hedera Hashgraph market has remained relatively range-bound for an extended period, albeit experiencing a marginal bullish shift as volatility increased slightly. Leveraging this volatility, bulls propelled the market from the $0.07 price level to $0.10. Since February 20, price swings have predominantly occurred around the $0.10 mark, predominantly favoring upside movement, indicative of bullish strength.
However, on April 13, the market found support at $0.08. From the crypto signal on the daily chart, we discovered that this support level became a pivotal level for catalyzing another surge in price into the $0.15 price zone.
Hedera Hashgraph Market Data
- HBAR/USD Price Now: $0.12
- HBAR/USD Market Cap: $4.4 billion
- HBAR/USD Circulating Supply: 35.7 billion
- HBAR/USD Total Supply: 50 billion
- HBAR/USD CoinMarketCap Ranking: #24
Key Levels
- Resistance: $0.16, $0.17, and $0.18.
- Support: $0.10, $0.09, and $0.08.
Hedera Hashgraph Through the Lens of Indicators
The current bearish candlestick signals robust bearish momentum in the market. The market reached a peak at a high of $0.18. After a period of consolidation with minor shifts in an upward direction, many long-standing investors are seizing the opportunity to capitalize on the market’s high by taking profits. Given the prevailing bearish momentum, there’s a possibility it could potentially erode the gains of the bullish market, leading to a regression to around the $0.10 price level.
However, the market’s tendency to exhibit more upward swings above the $0.10 price level than below it since February 20 underscores the enduring strength of the bulls. While sudden, strong price movements like this one typically trigger profit-taking, the underlying bullish sentiment suggests that bulls may find support at a higher level, possibly around the $0.12 price level.
HBAR/USD Price Prediction: 4-Hour Chart Analysis
Historically, the $0.12 price threshold holds significance to Hedera Hashgraph as a relevant level where bullish intervention could occur. However, given the current prevailing bearish momentum, the market might stabilize at this level as demand and supply reach equilibrium. This consolidation phase could potentially diminish the bearish momentum, paving the way for a resurgence of upward movement, aiming to reclaim the $0.18 price threshold.