Dogecoin (DOGE/USD) Trade Touches $0.075, Attempting a Correction
Estimated Reading Time: 3 minutes
Don’t invest unless you’re prepared to lose all the money you invest. This is a high-risk investment and you are unlikely to be protected if something goes wrong. Take 2 minutes to learn more

Dogecoin Price Prediction – October 30
Several moments of swing highs have featured between $0.075 and $0.0065 trade lines in the operations of Dogecoin versus the US currency, as the financial situation has had it that the crypto trade touches the resistance line of $0.075 to now attempt a correction.
Currently, rather than trading on an MT4 and its likes, actions related to such values that are carried out after reaching higher values will do well on investment platforms. The recovery path is still quite low since buyers want a stable bounce index in order to profit from their entries.
DOGE/USD Market
Key Levels:
Resistance levels: $0.075, $0.080, $0.085
Support levels: $0.060, $0.055, $0.050
DOGE/USD – Daily Chart
The DOGE/USD daily showcases the crypto-economic trade touching the resistance line of $0.075, attempting a correction.
The stochastic oscillators have been positioned jointly, maintaining the points approximately around 66. The Bollinger Band trend lines are positioned at $0.0728 and $0.0632, and the lower side is at $0.0535. The horizontal line drawn at $0.075 acts as the major trade barrier spot that bulls have to fearfully push past in the subsequent operations.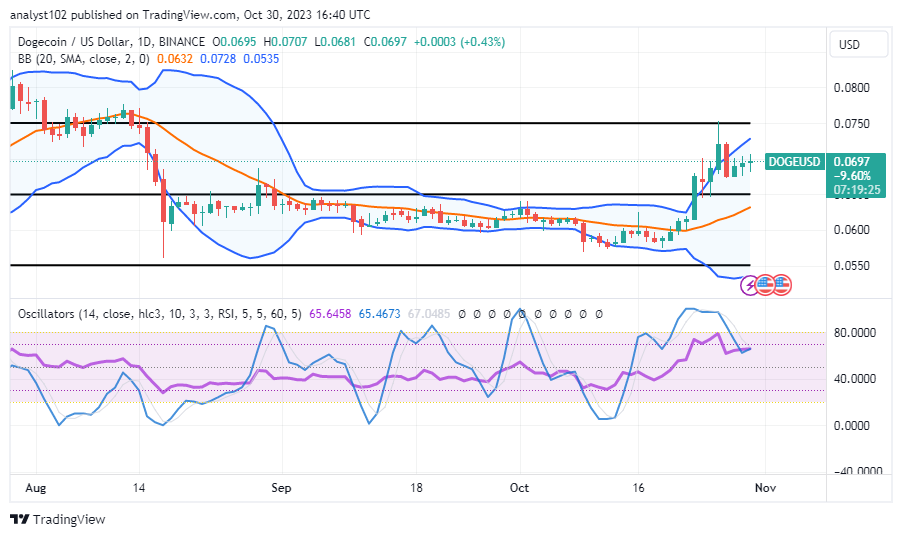
What psychological resistance line should the SOL/USD market be cautious of as it trades around $0.0697, given the growing strength of the crypto economies?
Bears are liable to get decent resistances to possibly get shorting position orders around the value of $0.075, as the DOGE/USD trade touches the value line, attempting a correction.
Ideal trade environments will definitely come to pass while buyers are strategic in their way of establishing entries when a false pulldown surfaces from a particular point higher than the spot that the price will eventually test. By so doing, it would be a better approach for long-term investors to act accordingly, as crypto has the potential to surge soon.
A noteworthy trajectory indicates that bulls have approached a line, indicating that it will soon begin a retracement. The first expected step toward getting that is for traders to use a daily chart to determine a critical resistance point before streamlining it to the use of lower time frames, such as 4-hour, 1-hour, or 15-minute, to decide when they are complimenting overbought conditions with active price action to signal the resumption of the retracement process.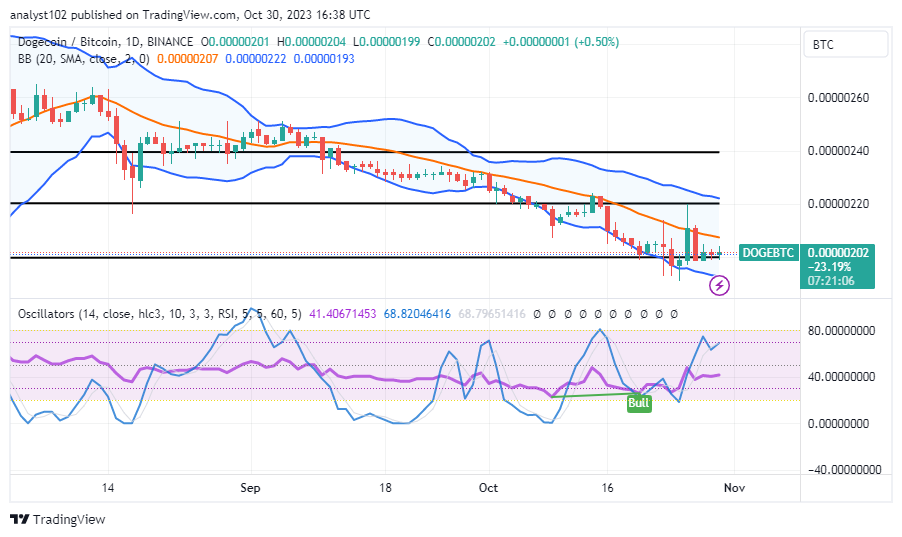
DOGE/BTC Price Analysis
In contrast, Dogecoin is still under a falling force with a lesser propensity capacity to go far below the lower trend line of the Bollinger Band against Bitcoin.
Since the candlestick formation has been between the middle and lower Bollinger Band trend lines, it appears that there are no more spaces for declining activities between the cryptocurrency pair. Overall, the Bollinger Bands have positioned themselves southward. The northern positions of the stochastic oscillators are 41.40671453 to 68.82046416. The base trading cryptocurrency has not yet reclaimed its position regarding the counter-crypto’s economic feasibility.
Note: Cryptosignals.org is not a financial advisor. Do your research before investing your funds in any financial asset or presented product or event. We are not responsible for your investing results.
You can purchase Lucky Block here. Buy LBLOCK